Ecological Pyramid
The ecological pyramid is a graphical representation to show the relationship between various organisms at various trophic levels in an ecosystem.
The concept of the ecological pyramid was first introduced by Charles Elton in 1927.
The base of a pyramid is broad and its apex is narrow. The shape is the same for the food or energy relationship between organisms at different tropic levels. The relationship between food and energy between organisms at various trophic levels is expressed in terms of number, biomass or energy.
The base of the pyramid represents producers (First tropic Level). The apex represents tertiary consumers (top-level consumers).
Usually, 3 Types of Pyramids are studied they are:
- Pyramid of Number
- Pyramid of Biomass
- Pyramid of Energy
Pyramid of Number

A pyramid of numbers is a graphical representation of the number of organisms at each trophic level in an ecosystem. The base of the pyramid represents the producers, which are the organisms that make their own food, such as plants. The next level of the pyramid represents the primary consumers, which are the organisms that eat the producers, such as herbivores. The next level represents the secondary consumers, which are the organisms that eat the primary consumers, such as carnivores. The pyramid can continue to higher levels, but the number of organisms typically decreases at each level.
There are three main types of pyramids of numbers:
- Upright pyramid: This is the most common type of pyramid of numbers, and it shows that there are typically more producers than primary consumers, more primary consumers than secondary consumers, and so on.
- Inverted pyramid: This type of pyramid of numbers is less common, and it shows that there are fewer producers than primary consumers, fewer primary consumers than secondary consumers, and so on.
- Partially upright pyramid: This type of pyramid of numbers is the most common in terrestrial ecosystems, and it shows that there are typically more producers than primary consumers, but fewer primary consumers than secondary consumers.
The shape of a pyramid of numbers can be affected by a number of factors, including the size and reproductive rate of the organisms at each trophic level, the efficiency of energy transfer between trophic levels, and the environmental conditions in the ecosystem.
Here is an example of a pyramid of numbers for a grassland ecosystem:
Producers: 100,000
Primary consumers: 10,000
Secondary consumers: 1,000
Tertiary consumers: 100
- Only three top carnivores could be supported in an ecosystem of nearly 6 Million plants.
Pyramid of Biomass
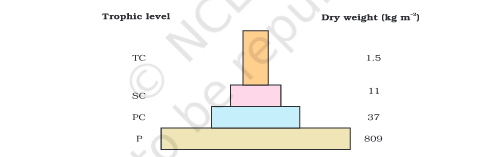
- In the Pyramid of Biomass, there is a sharp decrease in biomass at higher trophic levels.
A biomass pyramid is a graphical representation of the total mass of living organisms at each trophic level in an ecosystem. Biomass is typically measured in grams or kilograms per square meter or per cubic meter.
The base of the pyramid represents the producers, which are the organisms that make their own food, such as plants. The next level of the pyramid represents the primary consumers, which are the organisms that eat the producers, such as herbivores. The next level represents the secondary consumers, which are the organisms that eat the primary consumers, such as carnivores. The pyramid can continue to higher levels, but the total biomass typically decreases at each level.
There are three main types of pyramids of biomass:
Upright pyramid: This is the most common type of pyramid of biomass, and it shows that there is typically more biomass at lower trophic levels than at higher trophic levels. This is because only a small fraction of the energy that is captured by the producers is actually transferred to the next trophic level.
Inverted pyramid: This type of pyramid of biomass is less common, and it shows that there is more biomass at higher trophic levels than at lower trophic levels. This is typically only seen in marine ecosystems, where the producers, such as phytoplankton, are very small and very efficient at capturing energy from sunlight.
Partially upright pyramid: This type of pyramid of biomass is the most common in terrestrial ecosystems, and it shows that there is typically more biomass at lower trophic levels than at higher trophic levels, but the difference is not as great as in an upright pyramid.
The shape of a pyramid of biomass can be affected by a number of factors, including the size and reproductive rate of the organisms at each trophic level, the efficiency of energy transfer between trophic levels, and the environmental conditions in the ecosystem.
Here is an example of a pyramid of biomass for a grassland ecosystem:
Producers: 10,000 g/m^2
Primary consumers: 1,000 g/m^2
Secondary consumers: 100 g/m^2
Tertiary consumers: 10 g/m^2
As you can see, there is more biomass at lower trophic levels than at higher trophic levels. This is an example of an upright pyramid of biomass.
Pyramids of biomass are a useful tool for understanding the relationships between different trophic levels in an ecosystem. They can also be used to identify potential problems in an ecosystem, such as an overpopulation of a particular species.
Inverted Pyramid of Biomass

- In the inverted pyramid of biomass, a very small crop of phytoplankton supports large zooplankton.
In contrast to the typical pyramid of biomass, where the biomass of producers at the base of the food chain is greater than the biomass of consumers at higher levels, an inverted pyramid of biomass occurs when the biomass of consumers exceeds the biomass of producers. This phenomenon is most commonly observed in aquatic ecosystems, particularly in marine environments.
Several factors contribute to the occurrence of inverted pyramids of biomass in aquatic ecosystems:
- Rapid Growth and Short Lifespan of Producers: Phytoplankton, the primary producers in marine ecosystems, have a rapid growth rate and a short lifespan. They efficiently capture energy from sunlight and quickly convert it into biomass. This rapid turnover of phytoplankton contributes to a large standing stock of biomass despite their small size.
- Efficient Energy Transfer: Zooplankton, the primary consumers in marine ecosystems, are highly efficient at capturing and utilizing the energy from phytoplankton. They consume a significant portion of the phytoplankton biomass, leading to a relatively high biomass of zooplankton compared to phytoplankton.
- Detritus-Based Food Webs: Marine ecosystems often have a substantial detritus-based food web, where organic matter from dead organisms serves as a food source for detritus feeders. Detritus feeders, such as crustaceans and worms, contribute to the overall biomass of consumers in the ecosystem.
- Biomass Accumulation in Long-Lived Consumers: In some marine ecosystems, top predators, such as large fish or sharks, can have a long lifespan and accumulate substantial biomass over time. This can contribute to an inverted pyramid of biomass, as the biomass of these top predators may exceed the combined biomass of all lower trophic levels.
Examples of inverted pyramids of biomass include:
- Upwelling Ecosystems: In upwelling ecosystems, nutrient-rich water from deeper ocean layers rises to the surface, stimulating phytoplankton growth. This leads to a large abundance of phytoplankton, which supports a high biomass of zooplankton and other consumers.
- Coral Reef Ecosystems: Coral reefs provide a complex habitat that supports a diverse array of organisms, including a large biomass of zooplankton and fish. The rapid growth and turnover of coral reef organisms contribute to an inverted pyramid of biomass.
Inverted pyramids of biomass highlight the unique characteristics of aquatic ecosystems and the importance of efficient energy transfer within these systems. They also demonstrate the role of detritus-based food webs and the impact of long-lived top predators on the overall structure of the ecosystem.
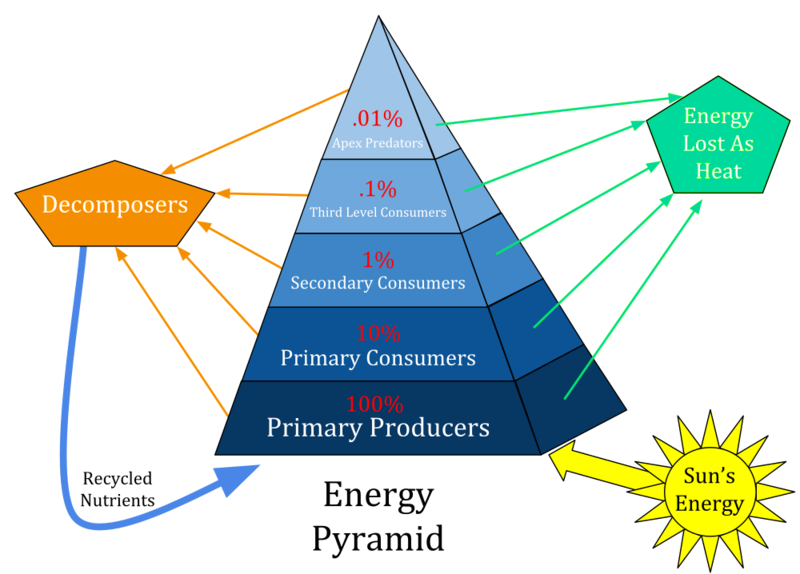
Pyramid of Energy
- The primary producers utilize and convert only 1% of the energy in the sunlight into NPP.
An energy pyramid, also known as an ecological pyramid, is a graphical representation of the flow of energy within a food chain or ecosystem. It depicts the transfer of energy from one trophic level to the next, starting with the primary producers at the base of the pyramid and moving up to secondary consumers, tertiary consumers, and apex predators at the top.
The energy pyramid illustrates the fundamental principle of ecology that energy cannot be created or destroyed, only transferred and transformed. As energy moves up the pyramid, a significant portion is lost at each level due to respiration, excretion, and other metabolic processes. Therefore, the amount of energy available to higher trophic levels diminishes as we move from the base to the top of the pyramid.
Characteristics of Energy Pyramids:
- Uni-directional flow: Energy flows in one direction, from producers to consumers.
- Decreasing energy: The amount of energy available decreases at each trophic level.
- Limited transfer efficiency: Only a small fraction of energy (typically 10-20%) is transferred from one level to the next.
- Ecological stability: Energy pyramids reflect the stability and balance of an ecosystem.
Types of Energy Pyramids:
- Upright Pyramid: The most common type, representing the general pattern of energy flow in most ecosystems.
- Inverted Pyramid: Less common, typically found in marine ecosystems where phytoplankton are highly efficient energy capturers.
- Partially Upright Pyramid: Combines features of upright and inverted pyramids, often seen in terrestrial ecosystems.
Significance of Energy Pyramids:
- Understanding energy flow: Energy pyramids provide a visual representation of energy transfer within ecosystems.
- Predicting ecological impacts: Changes in energy pyramid structure can indicate ecological disturbances or imbalances.
- Guiding human interventions: Energy pyramids inform sustainable resource management and conservation practices.
- Demonstrating ecological principles: Energy pyramids illustrate the concept of energy flow and the interconnectedness of organisms within an ecosystem.
Calculation of Energy Content
When calculating the energy content, the numbers of biomass. One needs to include all the organisms at that particular tropic level. If we take only a few individuals at any tropic level or generalisation will not give current values.
The important thing is trophic level represents a functional level, not a species.
Species with multiple tropical levels
For example, Sparrow is a primary consumer, when it consumes fruits, peas etc. The same sparrow becomes a secondary consumer when it consumes insects and worms. Similarly, humans are part of multiple trophic levels.
Many species occupy multiple trophic levels within an ecosystem, meaning they derive sustenance from different sources across various levels of the food chain. This adaptability and flexibility allow them to thrive in diverse environments and contribute to the stability of ecological systems.
Here are some examples of species that occupy multiple trophic levels:
- Giant Panda: Primarily herbivorous, consuming bamboo as their main food source, giant pandas occasionally scavenge for small mammals, insects, and eggs, placing them in both primary and secondary consumer roles.
- Salmon: Salmon undergo a remarkable transformation throughout their life cycle. As juveniles in freshwater, they feed on plankton as primary consumers. Upon migrating to the ocean, they transition to a predatory diet, consuming fish and crustaceans as secondary consumers.
- Omnivores: By definition, omnivores occupy multiple trophic levels, consuming both plant and animal matter. Humans, raccoons, bears, and many birds are examples of omnivores.
- Parasitic Organisms: Parasites extract nutrients and energy from their hosts, effectively occupying two trophic levels simultaneously. Tapeworms, leeches, and fleas are examples of parasites.
- Detritivores: Detritivores derive sustenance from decaying organic matter, breaking down detritus and recycling nutrients back into the ecosystem. Earthworms, vultures, and many insects are detritivores.
These examples demonstrate the diverse strategies employed by species to occupy multiple trophic levels. These adaptations allow them to exploit various food sources, enhance their survival, and contribute to the complex web of interactions within ecosystems.
The ecological pyramid is always upright
In most ecosystem, the Pyramids of Biomass, energy, and number is always upright. For example,
- Producers are more in number and biomass than the herbivores,
- Herbivores are more in number and biomass than carnivores.
But importantly, there are exceptions. Such as insects feeding on trees. The number of insects is very high.
Also, the pyramid of biomass in the sea is generally inverted. The biomass of fishes exceeds the phytoplankton.
Pyramid of Energy is always Upright
The pyramid of energy is always upright and it is never inverted. This is because the energy flows from a particular trophic level to the next trophic level. As a result, some energy is always lost as heat at every step.
Each bar in the energy pyramid indicates the amount of energy present at each trophic level at a given time or annually per unit area.
Conclusion
However, there are some limitations of ecological pyramids. As it does not take into account the same species belonging to two or more trophic levels.
Also, the ecological pyramid assumes a simple food chain that never exists in nature and it does not accommodate a food web.
Also, saprophytes are not given any place in ecological pyramids even though
they have an important role in the ecosystem.
References
- https://ncert.nic.in/textbook/pdf/lebo114.pdf