Economic trends in Tamilnadu Tnpsc
The economic and social development of Indian states is not uniform and there exists a wide regional disparity. The Southern and Western parts of India are better than the rest of India.
The economy of Tamil Nadu is the 11th largest and 6th most populated state in India. Tamil Nadu economic growth in terms of GDP, Tamil Nadu is second in India.
Tamil Nadu economy is the 3rd highest in terms of Per Capita Income, investment, Foreign Direct Investment (FDI), and Industrial Output. As per the Economic freedom report, Tamil Nadu has been ranked the most economically free state.
In terms of the health and social sector, Tamil Nadu is better than many other states and better than the national average in terms of higher education, health, MMR, and IMR.
Best books for Tnpsc exams/Upsc
Economic Development
The Tamil Nadu economic growth is the fastest growth of SGDP since 2005. Poverty reduction is faster than in other states.
It contains less proportion of the poor population in India. It is the second-largest contributor to India’s GDP. According to UNDP-2015, Tamil Nadu ranks third in the Human Development Index (HDI).
In terms of Invested capital, Tamil ranks third with 2.92 Lakh Crore Rupees and the value of the total industrial output of 6.19 Lakh Crore Rupees.
In terms of the number of factories and industrial workers, Tamil Nadu stands first with a 17% share in Industry and a 16% share in Industrial workers across the country. As per the Niti Aayog report, Tamil Nadu is placed in Health Index.
It has the highest Gross Enrolment Ratio in Higher Education in India. It has the highest number of Engineering Colleges in India. Tamil Nadu is a major hub for renewable energy.
In terms of the credit deposit ratio in commercial and cooperative banks, Tamil Nadu has the highest credit. It has the highest ranks, first on investment proposals filed by MSME.
Human Development Indicators in Tamilnadu and a comparative assessment across the country
Maharashtra and Gujarat seem to perform in some economic indicators. Kerala ranks first in Literacy, IMR, and MMR.
Tamil Nadu in recent years has done outstanding performance far ahead of other states in terms of Health, Higher Education, Growth of MSME, job generation, and poverty alleviation.
In the Health Index report, Kerala and Punjab tops and Tamil Nadu are in the third spot.
The Neo mortality rate is 14 lower than that of many Indian states and also under 5 mortality has dropped from 21 in 2014 to 20 in 2015 as per Healthy States, Progressive India Report 2018 by Niti Aayog.
The success of Tamil Nadu is because of its social policies to cover most of the people for example the Public Distribution System(PDS), Midday meals, and Health Infrastructure has reached the masses.
Water Resources
The state is not gifted with natural resources like other states. It has only 3% of water sources, 4% of land area for 6% of the population of India. It depends on the North-East monsoon which is a major source of Rainfall and is followed by South West Monsoon.
It has 17 river basins, the main rivers are Palar, Cheyyar, Cauvery, Chittar, Vaigai, Bhavani, etc. The largest source of irrigation in the state is Wells, about 56%.
Water Resources
| Source of Irrigation | Numbers |
| Reservoirs | 81 |
| Canals | 2239 |
| Tanks | 41262 |
| Tube Wells | 3,20,707 |
| Open Wells | 14,92,359 |
Source: State Government Season & Crop Report 2012-13
Mineral Resources
Tamil has Titanium, Lignite, Magnesite, Graphite, Limestone, Granite, and Bauxite mines and projects. There is a large Industrial complex developed across Neyveli, such as Neyveli Lignite Corporation, Thermal Power Plant, Fertilizer, and Carbonisation plants.
Magnesite mining at Salem where Bauxite ores are taken out at Yercaud and this region is rich in Iron Ore, Kanjamalai. In Dharmapuri, Molybdenum is found and it is found only in this place in India.
Mineral Resources
| Mineral National | Reserve (Tonnes) | Share |
| Lignite | 30,275,000 | 87% |
| Vermiculite | 2,000,000 | 66% |
| Garnet | 23,000,000 | 42% |
| Zircon | 8,000,000 | 38% |
| Graphite | 2,000,000 | 33% |
| Ilmenite | 98,000,000 | 28% |
| Rutile | 5,000,000 | 27% |
| Monazite | 2,000,000 | 25% |
| Magnesite | 73,000,000 | 17% |
(Source: Department. of Geology and Mining)
The Population of the State
Its population is 7.21 crore, 6th in India’s 121 crores as per the 2011 census. The population is higher than in many countries according to the UN Report.
| State / Country | Population (in Crore) |
| Tamil Nadu | 7.2 |
| The U.K. | 6.5 |
| France | 6.5 |
| Italy | 5.9 |
| South Africa | 5.6 |
| Spain | 4.7 |
| Sri Lanka | 2.1 |
(Source: Projections published by the United Nations in the 2017 Revision of World Population Prospects.)
Population density
The population density is 555 per sq. km in 2011. Tamil Nadu stands 12th in population density. India’s population density is 382 per sq. km.
Urbanization
It is the most urbanized state in India with 48% of the urban population which is higher than the national average of 31.5%. That is 9.61% of total urbanites in India against 6% of the total population.
The sex ratio of Tamil Nadu is almost 995 which is far better than most of the states. It stands third in the sex ratio, only next to Kerala and Puducherry.
Sex Ratio
| Indicator | Tamil Nadu | India |
| IMR | 17 | 34 |
| MMR | 79 | 159 |
| Life Expectancy Total Male Female | 70.668.672.7 | 67.966.469.6 |
| Literacy Rate Total Male Female | 80.33 %86.81 %73.86 % | 74.04 %82.14 %65.46 % |
| Sex Ratio | 995 | 940 |
IMR (Infant Mortality Rate) which is mortality before completing 1 year, is higher than the national average and most other states. As Niti Aayog report, IMR is 17 (per 1000), which is half of the national average of 34 as in 2016.
MMR (Maternal Mortality Rate) which mother’s death at the time of delivery per 1 lakh, Tamil Nadu ranks third with 79 only after Kerala with 61 and Maharashtra with 67. The national average MMR is 159.
Life Expectancy at birth
It is the average period that a person expects to live is called Life expectancy and India well below most developed and developing nations.
Literacy
The literacy rate of the states is higher than in many Indian states.
Gross State Domestic Product (GSDP)
It is the total money value of all the goods and services produced in the state. According to the Directorate of Economics and Statistics, Tamil Nadu, In India, the state of Tamil Nadu ranks second in GSDP.
The GSDP in 2016-2017 is $207.8 billion.
The GSDP of the state is equal to the GDP of Kuwait on Nominal terms and the GDP of UAE on PPP terms. Tamil Nadu’s GSDP is far higher than in many countries, this is mainly due to the population effect.
| State / Country | GSDP /GDP(Billion) |
| Tamil Nadu-GSDP | $ 207.8 |
| Iraq-GDP | $ 171 |
| New Zealand-GDP | $ 184 |
| Sri Lanka-GDP | $ 81 |
(Source: IMF Outlook, April 2017)
Sectoral Contribution of Industries
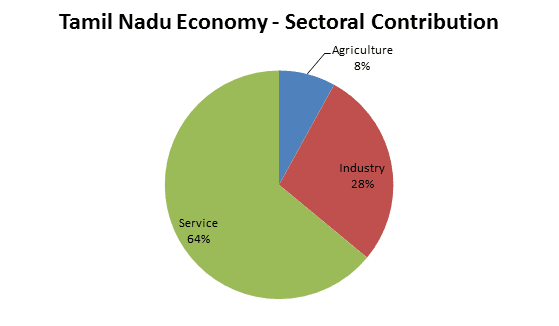
The major contributor to the economy is the tertiary sector/ service sector with GSDP of 63.7%. The industry sector/ secondary sector is growing rapidly at 28.5% GSDP.
The agriculture sector is now declining, the current GSDP is 7.76%. Tertiary and secondary have the upper hand over the agriculture sector in the state and this economic trend in Tamil Nadu is not good for sustainable development.
Per capita Income of the State
The per capita income is 1.75 times higher than the national average as per the 2018 census and that is $2200. It has increased rapidly from ₹ 1,03,600 in 2010-11 to ₹1,88,492 in 2017-18.
| State / Country | Per capita Income(in USD) |
| Tamilnadu | 2200 |
| India | 1670 |
| Nigeria | 2175 |
| Nicaragua | 2151 |
| Pakistan | 1443 |
| Bangladesh | 1358 |
| Zimbabwe | 1029 |
| Nepal | 729 |
(Source: World Bank National Accounts data, and OECD National Accounts data files. –https://data. worldbank.org/indicator/NY.GDP.PCAP.CD)
| State | State PI (₹) |
| Tamil Nadu | 1,57,116 |
| Kerala | 1,55,516 |
| Karnataka | 1,46,416 |
| Telangana | 1,58,360 |
| Andhra Pradesh | 1,37,000 |
(Source: Reserve Bank of India, New Delhi. February 2017.)
Agriculture
Tamil Nadu has different soil types and severs agro-climatic zones and it is good for crops such as fruits, vegetation, spices, plantation crops, flower, and medicinal plants.
It is the largest producer of loose flowers and third in fruits. It is the second-largest producer of rice. First is West Bengal. It is also the largest producer of Turmeric.
It is also the largest producer of Kambu, Groundnut, Oilseeds, Sugarcane, and corn. It is the largest producer of bananas in the country and the second-largest producer of rubber, cashew, and coconut.
It is the third-largest producer of pepper and the fourth-largest producer of sugarcane.
The total gross cropped area under cultivation is 58.97 Lack Hectares in 2013-2014. The area under food cultivation is 72.9%. Paddy is the major food crop and among the non-food crops coconut and groundnut are major ones
Food grain Production
Tamil Nadu producers 79.49 Lakh tones of Rice in 2015-16, 40.79 Lakh tonnes of Millets in 2015-2016, Pulses of 3.59 Lakh tonnes in 2011-2012.
Productivity Position
| Crop | Position of Tamil Nadu at National Level |
| Maize | 1 |
| Cumbu | 1 |
| Groundnut | 1 |
| Total Oilseeds | 1 |
| Cotton | 1 |
| Coconut | 2 |
| Rice | 2 |
| Sugarcane | 3 |
| Sunflower | 3 |
| Jowar | 3 |
| Coarse cereals | 4 |
| Total Pulses | 8 |
Source: Agriculture Department Policy Note 2017-18
The economy of Tamil Nadu: Industry in the State
Chennai is called the Health and Banking capital of India. It is also called Detroit of Asia due to a Large number of automobile industries’ presence.
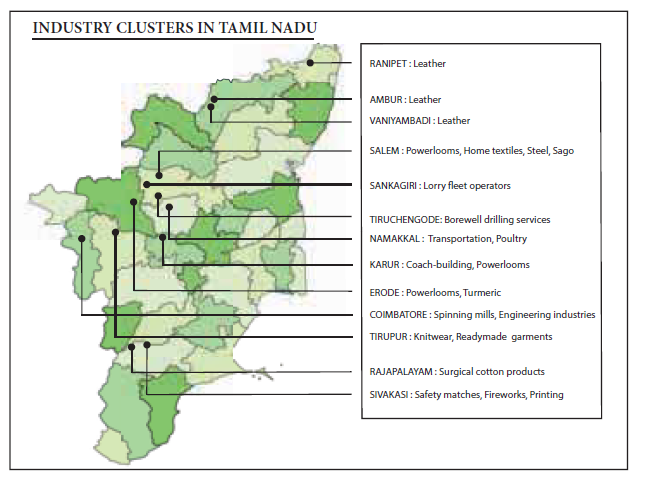
It has 110 industrial estates and parks. The state government also supports Rubber Parks, Apparel parks, Floriculture Park, Ticel park for biotechnology and IT parks in Siruseri and Agro Export Zones.
Automobile and heavy engineering industries are around the suburbs of the capital city. Karur is famous for bus bodybuilding, it builts 80% of buses in south India.
TNPL, a government enterprise is Asia’s largest producer of eco-friendly paper. Salem is called a steel city, has a large number of metallurgical and mining industries.
Sivakasi is the largest in India in Printing, Matchmaking, and fireworks, its products are 80% of total matchboxes and 90% of total fireworks in the country. Thoothukudi is the called Gateway of the state, is the second-largest Chemical producer after Chennai
Textiles Industries

Tamil Nadu is known as the “Yarn Bowl” of the country and its largest textile hub in India. The textile industry provides direct employment to almost 35 million people which contributes 4% of GDP and 35 % of gross export earnings.
The textile industry contributes 14% to manufacturing industries. The state has India’s half of the spinning mills.
The majority of the spinning industry is present in the western part of Tamil Nadu, such as Karur, Erode, Tirupur, Dindigul.
These spinning mills manufacture blended yarn, silk yarn, polyester yarn, cotton yarn which are used by various states such as Maharastra, Tamil Nadu, etc, also exported to Bangladesh, China, etc.
Tirupur called “Knitting City”, exports of garments well worth USD three Billion.
Karur is also a prime producer of domestic textile garments consisting of Curtain material, mattress linens, kitchen linens, restroom linens, desk linens, wall hangings, and many others and export hubs in India.
Erode is the principal cloth market in South India for retail as well as wholesale ready-mades.
Leather Industries
The state makes 30% of leather-based exports and approximately 70 % cent of leather-based production in India.
Hundreds of leather-based and tannery industries are positioned around Vellore, Dindigul, and Erode. Every year the state hosts the India International Leather Fair in Chennai.
Electronics Industries
Chennai has emerged as the EMS Hub of India. Many multinational companies have selected Chennai as their South Asian manufacturing hub.
Automotive Industries
Chennai is called “The Detroit of Asia” as it is home to many large car part manufacturing companies.
Tamil Nadu has a 28% share in automotive and auto components industries, 19% within the trucks phase, and 18% passenger cars and two-wheelers.
Cement Industry
The state ranks at number three in cement production in-country, after Andra Pradesh and Rajasthan.
Among the 10 largest cement companies in India in 2018, Ramco Cement and India Cement of Tamil Nadu are based to find a good position.
And additionally, the state stands only next to Andra Pradesh in the number of cement plants. Andra Pradesh tops with 35 plants and Tamil Nadu with 21 plants.
Fireworks Industry
The town of Sivakasi is the topper in the areas of printing, fireworks, and safety matches. Sivakasi referred to as “Little Japan” by Jawaharlal Nehru.
It contributes 80% of India’s fireworks production. Sivakasi provides over 60% of India’s total offset printing solutions.
Other Industries
BHEL (Bharat Heavy Electricals Limited) has a plant in Tiruchi and Ranipet.
The state government of Tamil Nadu has its own Paper production company called TNPL(Tamil Nadu Newsprint and Paper Limited) and its world’s largest bagasse paper mill in Karur.
Tamil Nadu is one of the largest cement producers in India and has plants in Ariyalur, Virudhunagar, Coimbatore, and Tirunelveli.
The Salem city outskirts are mineral-rich, SAIL a Government of India company for steel products has plants in Salem.
About two-thirds of country’s Pumps are produced in Coimbatore and it is famously called “the Pump City”.
It satisfies the need for two-third of countries’ requirements for vehicles and pumps.
Coimbatore is also the leading exporter of Jewellery, wet grinders, and auto additives. “Coimbatore wet grinder” is added to the GI tag.
“The gateway of Tamil Nadu”, Thoothukudi, is the major chemical manufacturing hub in the state, it also produces 70% of salt in Tamil Nadu and 30% of salt in India.
MSME
The Micro, Small, and Medium Enterprises are defined under the MSMED Act 2006.
It is classified as a manufacturing and service enterprise based on investment in plant and machinery and equipment excluding land and building.
Tamil Nadu has 15.07% MSME in the country which is the highest in the country with 6.89 Lakh registered MSME.
Tamil Nadu accounts for 15.07% of Micro, Small and Medium Enterprises (MSMEs) in the country( the highest among all States) with 6.89 lakhs registered MSMEs.
MSME in Tamil Nadu produces over 8000 varieties of products and MSME investment is more than Rs 32,008 crore.
The product includes Engineering, Chemicals, Garments, etc. About 15.61 Lakh entrepreneurs provide employment to 99.7 lakhs with the capital of Rs. 1,68,331 crore.
Economy of Tamil Nadu: Energy Sector in Tamil Nadu
Tamil Nadu is the largest power producer in South India.
| State | Units | Ranks |
| Tamil Nadu | 26,865 MW | I |
| Karnataka | 18,641 MW | II |
| Andhra Pradesh | 17,289 MW | III |
| Telangana | 12,691 MW | IV |
| Kerala | 4,141 MW | V |
| Total Power | 79,627 MW |
(“Source: Central Electricity Authority, Ministry of Power, Government of India. Retrieved Jan.2017” )
Tamil Nadu is the leader in installed capacity of power plants pan India.
Muppandal wind farm is a renewable energy source that supplies power to villagers for work. Wind Mill is being installed in Tuticorin and Nagercoil.
Tamil Nadu already has installed windmills in Coimbatore, Pollachi, Dharapuram, and Udumalaipettai. Wind Mills of Tamil Nadu produces more than half of India’s wind power and 2% of the total power of the country is about 2000 megawatts.
Nuclear Energy in Tamil Nadu
Kalpakkam and Koodankulam Nuclear power plants are major nuclear plants in Tamil Nadu.
| Units | Existing Installed capacity (2018) |
| Kudankulam | 1834 MW (2 x 917) |
| Kalpakkam | 470 MW (2 x 235) |
Thermal Power in Tamil Nadu
The thermal power plant is in Athippattu in North Chennai, Ennore, Mettur, Neyveli, and Thoothukudi. The generation of power under various sources is given below.
| Source | Million Units | % |
| Thermal | 13304 | 49.52 |
| Hydel | 2203 | 8.20 |
| Nuclear | 986 | 3.67 |
| Others (Wind,Solar) | 3.67 | 38.61 |
| Total | 26865 | 100.00 |
(“Source: Central Electricity Authority, Ministry of Power, Government of India. Retrieved 15 Jan.2017.”)
Hydel Energy in Tamil Nadu
Tamil Nadu has 20 Hydroelectric units, the famous ones are Hundah, Mettur, Periyar, Maravakandy, Parson Valley, etc
Solar Energy in Tamil Nadu
Tamil Nadu tops in solar power generation in India as seen in the following table.
Southern Tamil Nadu is considered one of the most suitable regions in the country for developing solar power projects.
| Ranking | States | Total capacity(MW) 2017 |
| 1 | Tamil Nadu | 1590.97 |
| 2 | Rajasthan | 1317.64 |
| 3 | Gujarat | 1159.76 |
| 4 | Telangana | 1073.41 |
| 5 | Andhra Pradesh | 979.65 |
(Source: Data from MNRE)
Wind Energy in Tamil Nadu
Tamil Nadu has the largest wind power in India. The State has a very high quality of offshore wind energy potential of the Tirunelveli coast and southern Thoothukudi and Rameswaram coast.
Service sector in Tamil Nadu
The tertiary sector or Service sector is Banking, Insurance, Energy, Transport, and Communication.
Banking Sector in Tamil Nadu
In Tamil Nadu, People have 52% of bank accounts in Nationalised banks with 5337 branches in the state, 30% in Private Banks with around 3060 branches, 5% or 537 branches of Rural banks, and 22% in foreign bank branches.
There is an increase in deposits by 14.32% by March 2017 and reached ₹6,65,068.59 crores. The credit of banks also increase by 13.5% by March 2017 and reached ₹6,95,500.31 crores.
In the Priority Sector Advances, the share stands higher than the countries’ average 40% with 45.45%.
Agricultural advances are also higher than the national average of 18%, whereas Tamil Nadu has 19.81%. The credit Deposit Ratio is also higher than the countries average of 77.5%, where Tamil Nadu maintains 119.15%.
Education and health systems in tamil nadu tnpsc
Education in Tamil Nadu

a. School Education
Tamil Nadu is grouped among high Gross Enrolment Ratio (GER) States. It ranks third next only to Kerala (81%) and Himachal Pradesh (74%). The all India average is 43% and the world average is 59%.
Tamil Nadu’s primary education statistics 2016-17
| Primary | 35,414 |
| Middle | 9,708 |
| High and Higher Secondary | 12,911 |
(Source: Tamil Nadu State portal, State interim Budget 2016-17)
Gross Enrolment Ratio is 118.8% for primary level(class 1-5); 112.3% for upper primary level (class 6-8), 62.7% for secondary level (class 9-10), 49.26% at Higher Secondary level (class 11-12).
This has been possible mainly due to the supply of free food, cloth, footwear, scholarship, laptop, etc.
Higher Education
In Gross Enrolment Ratio under higher education (Tertiary level) Tamil Nadu continues to be at the top level well ahead of other states.
The GER is 46.9% in Tamil Nadu which is far higher than the national average and all other States.
This higher GER is thanks to the distribution of free food, cloth, footwear, laptop, and scholarship.
| State | 2016-17 |
| Tamil Nadu | 46.9 |
| Maharashtra | 30.2 |
| Uttar Pradesh | 24.9 |
| Odisha | 21.0 |
| Bihar | 14.4 |
| All India | 25.2 |
(Source: All India Survey on Higher Education (AISHE) released by the Ministry of Human Resource Development- January 2018)
Tamil Nadu has 59 Universities, 40 Medical Colleges, 517 Engineering colleges, 2,260 Arts and Science colleges, 447 Polytechnics, and 20 dental colleges.
Tamil Nadu produces nearly four lakh engineering and polytechnic students every year, the highest in the country.
Educational Loans
Tamil Nadu takes maximum education loans from Public Sector Banks of about 20.8% between 2013-2014 and 2015-16.
Andhra Pradesh was second with 11.2% of the total loan amount followed by Maharashtra (10.2%).
Tamil Nadu stands second in getting education load from Private Banks during 2013-2016 of about 24.8% only next to Kerala of about 37.8%.
Karnataka and Kerala get more than 60% of education loans from private banks.
Health
Tamil Nadu has a three-tier health infrastructure comprising hospitals, primary health centers, health units, community health centers, and subcentres.
As of March 2015, the State has 34 district hospitals, 229 sub-divisional hospitals, 1,254 primary health centers, 7,555 Sub-centres, and 313 community health centers.
Transport and Communication in Tamil Nadu tnpsc
Communication
Tamil Nadu has second in terms of internet subscribers in the country of about 28.01 million, First is Maharashtra with 29.47 million users.
Next to Tamil Nadu are Andra Pradesh (24.87 million) and Karnataka (22.63 million). As per government data, there are 342.65 million internet subscribers in March 2016, India.
Transport
Tamil Nadu has a well-established transportation system that joins all parts of the State. This is partly responsible for the investment in the State.
Tamil Nadu is served by an extensive road network in terms of its spread and quality, providing links between urban centers, agricultural market-places, and rural habitations in the countryside.
However, there is scope for improvement.
a. Road
There are 28 national highways in the State, covering a total distance of 5,036 km.
The State has a total road length of 167,000 km, of which 60,628 km are maintained by the Highways Department.
It ranks second in India with a share of over 20% of total road projects under operation in the public-private partnership (PPP) model.
b. Rail
Tamil Nadu has a well-developed rail network as part of Southern Railway, headquartered in Chennai.
The present Southern Railway network extends over a large area of India’s Southern Peninsula, covering the States of Tamil Nadu, Kerala, Puducherry, minor portions of Karnataka, and Andhra Pradesh.
Tamil Nadu has a total railway track length of 6,693 km and there are690 railway stations in the State.
The system connects it with most major cities in India.
Main rail junctions in the State include Chennai, Coimbatore, Erode, Madurai, Salem, Tiruchirapalli, and Tirunelveli.
Chennai has a well-established Suburban Railway network, a Mass Rapid Transport System, and is currently developing a Metro system, with its first underground stretch operational since May 2017.
c. Air
Tamil Nadu has four major international airports. Chennai International Airport is currently the third-largest airport in India after Mumbai and Delhi.
Other international airports in Tamil Nadu include Coimbatore International Airport, Madurai International Airport, and Tiruchirapalli International Airport.
It also has domestic airports at Tuticorin, Salem, and Madurai which connect several parts of the country.
Increased industrial activity has given rise to an increase in passenger traffic as well as freight movement which has been growing at over 18 percent per year.
d. Ports
Tamil Nadu has three major ports; one each at Chennai, Ennore, and Tuticorin, as well as one intermediate port in Nagapattinam, and 23 minor ports.
The ports are currently capable of handling over 73 million metric tonnes of cargo annually (24 percent share of India).
All the minor ports are managed by the Tamil Nadu Maritime Board, Chennai Port.
This is an artificial harbor and the second principal port in the country for handling containers.
It is currently being upgraded to have a dedicated terminal for cars capable of handling 4,00,000 vehicles.
Ennore Port was recently converted from an intermediate port to a major port and handles all the coal and ore traffic in Tamil Nadu.
Tourism
Tamil Nadu has since ancient past been a hub for tourism. In recent years, the state has emerged as one of the leading tourist destinations for both domestic and foreign tourists.
Tourism in Tamil Nadu is promoted by Tamil Nadu Tourism Development Corporation (TTDC), a Government of Tamil Nadu undertaking.
The State currently ranks the highest among Indian states with about 25 crore arrivals (in 2013).
The annual growth rate of this industry stood at 16 percent. Approximately 28 lakh foreign and 11 crore domestic tourists visit the State.
Unemployment and Poverty
The national average unemployment rate stands at 50 and Tamil Nadu ranks and foreign tourists. Tourism in Tamil Nadu is promoted by Tamil Nadu Tourism Development Corporation (TTDC), a Government of Tamil Nadu undertaking.
The State currently ranks the highest among Indian states with about 25 crore arrivals (in 2013). The annual growth rate of this industry stood at 16 percent.
Approximately 28 lakh foreign and 11 crore domestic tourists visit the State. 22nd with an unemployment rate of 42 per 1000.
There are different kinds of unemployment with different economic implications. All those aspects need to be studied to fully understand the employment situation.
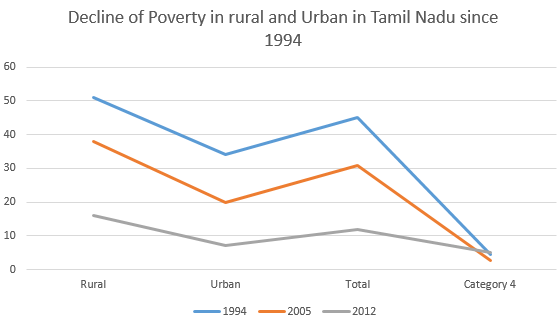
Tamil Nadu is one of India’s richest states Since 1994, the state has seen a steady decline in poverty.
Today, Tamil Nadu has lower levels of poverty than most other states in the country. After 2005, Tamil Nadu was among India’s fastest-growing states, with growth being driven mainly by services.

| Total Population | 72138958 |
| Male | 36158871 |
| Female | 35980087 |
| Crude birth rate (per thousand) | 15.7 |
| Crude death rate (per thousand) | 7.4 |
| Growth Rate (per thousand) | 8.3 |
| Districts with Highest Population | Chennai, Kancheepuram, Vellore, and Thiruvallur |
| Districts with Lowest Population | Perambalur, The Nilgiris, Ariyalur, and Theni |
| Population Density (per sq km) | 555 (2011), 480 (2001) |
| Maximum Density | Chennai (26903 |
| Minimum Density | Nilgiris (288) |
| Sex Ratio (per 1000 males) | 995 females (2011), 987 females (2001) |
| District with Highest Sex Ratio | Nilgiris (1041 females), Thanjavur (1031 females), Nagapattinam (1025 females) |
| District with Lowest Sex Ratio | Theni (900 females), Dharmapuri (946 females) |
| Child Sex Ratio (0-6 age group) | 946 female children (2011), 942 female children (2001) |
| District with Highest Child Sex Ratio | The Nilgiris (985), Kanyakumari (964) |
| District with Lowest Child Sex Ratio | Cuddalore (896), Ariyalur (897) |
| Literacy Rate | 80.33% (2011), 73.45% (2001) |
| Male Literacy | 86.81% (2011), 82.33% (2001) |
| Female Literacy | 73.86% (2011), 64.55% (2001) |
| District with Highest Literacy | Kanyakumari (92.14%), Chennai 90.33%) |
| District with Lowest Literacy | Dharmapuri(64.71%), Ariyalur (71.99%) |
Economic Trends in Tamilnadu Tnpsc Pdf
Role and impact of social welfare schemes in the socio-economic development of Tamilnadu