Economics Notes Links

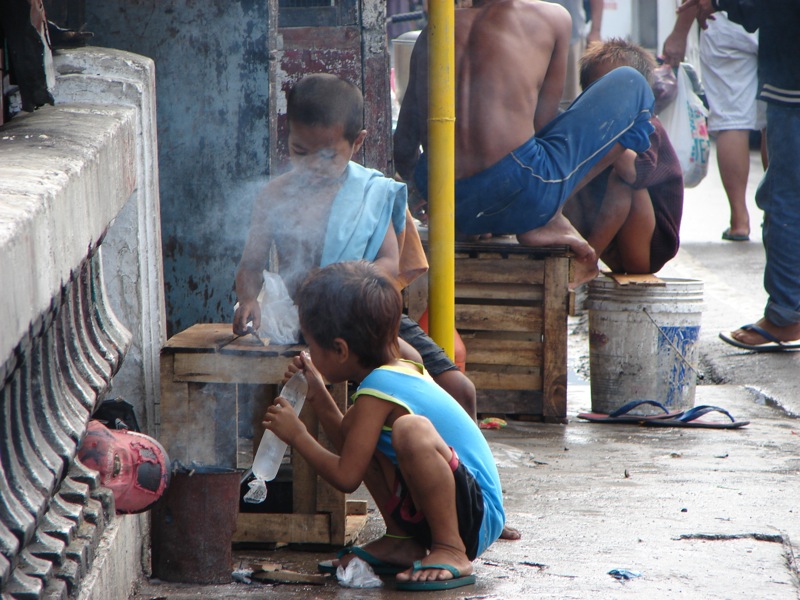
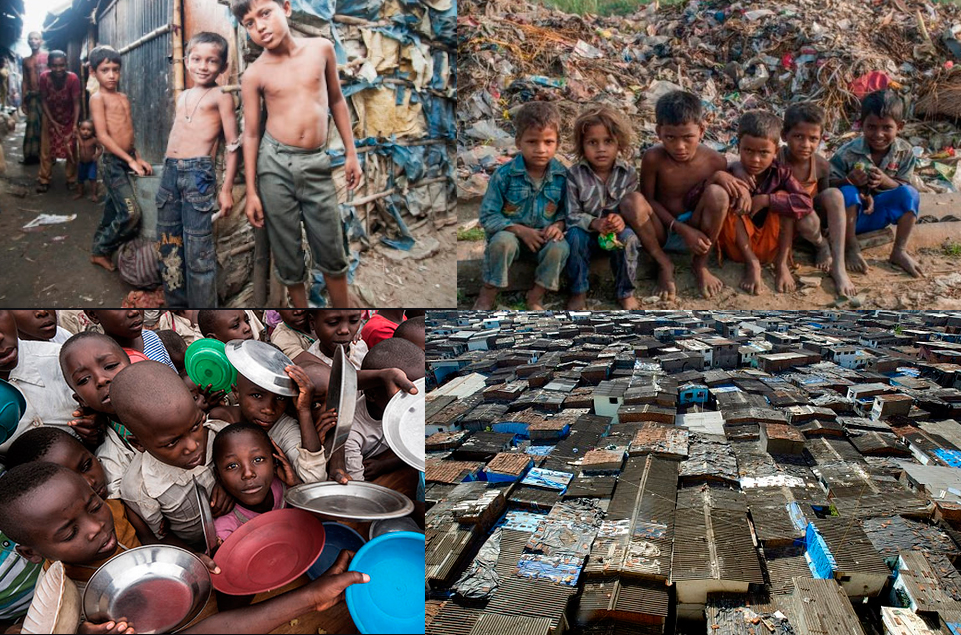
Economic Topics 1.Human Development Report and Indices Physical Quality Life Index (PQLI) Technology Achievement Index(TAI) Gender Development Index(GDI) Human Poverty Index(HPI) Human Development Index(HDI) 2. Poverty and Unemployment 3. Banking RBI Commercial Banks Monetary 4. Fiscal / Budgetary Policy Revenue Expenditure Recommendation of the 125 th finance commitee. 5. Inflation- 6. Stock Market 7. Foreign … Read more