Water resources in India Upsc

Water resources in India

India has only 4% of the World’s renewable water resources. On the other hand, it is home to nearly 16% of the Worlds population.

Management of water resources in India is the most vital thing today to sustain a one billion-plus population. India account, for 2.4% of the entire world area.

It includes 4% of the planet’s water resources and 16% of the population of the world. Of which the entire water from precipitation in India is 4000 cubic km during a year.

Also, the supply of groundwater and surface water is 1869 cubic km and out of which only 60% is usable for domestic use.

As a result, India’s entire utilizable water resource is merely 1122 cubic km.

Surface Water Resources in India

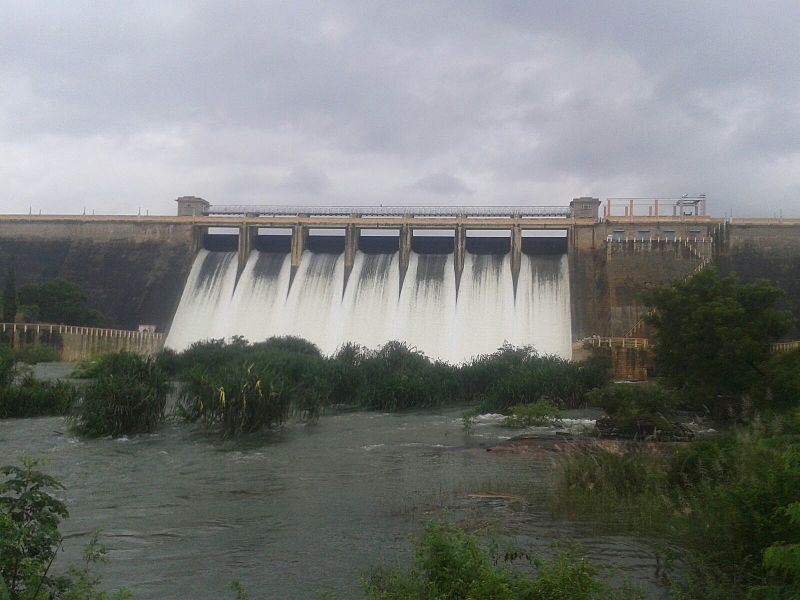
There are four major surface water resources in India. These are rivers, lakes, ponds, and tanks. In India, there are about 10,360 rivers and their tributaries longer than 1.6 km each.

The mean annual flow altogether to the river basins in India is estimated to be 1,869 cubic km.

But due to hydrological, topographical, and other reasons, only 690 cubic km (32%) of obtainable surface water are often utilized.

The water flow within the rivers depends on the catchment basin, rivers basin size, and rainfall within its catchment basin.

The precipitation is high within the catchment areas of the Ganga, the Brahmaputra, and therefore the Barak rivers. These three rivers account for less than one-third of the entire area in India. But has 60 percent of the entire surface water resources.

Comparatively much of the annual water flow in south Indian rivers just like the Godavari, Krishna, and Kaveri has been harnessed well. But it’s yet to be wiped out the Brahmaputra and therefore the Ganga basins.

Groundwater resources in India

Rainfall is the biggest source of groundwater recharge in India. Also the groundwater is recharged from canals, irrigated fields and surface water bodies.

There are 432 cubic km of total replenishable groundwater resources within the country. Its utilization is extremely high within the basin that lies within the north-western region and South India.

States like Punjab, Rajasthan, and Tamil Nadu utilize the groundwater quite high than the others. Also, other states like Chhattisgarh, Odisha, Kerala, etc utilize the groundwater to some extent.

States like Gujarat, Uttar Pradesh, Bihar, Tripura, and Maharashtra are utilizing their groundwater resources at a moderate rate.

The more groundwater usage, the demand for the water would wish the supplies. Such situations are detrimental to the country’s development and make social eruptions and confusion.

State with most groundwater resource in India

As per the data from Central Water Commission (CWC), Uttar Pradesh has highest percentage of total annual replenishable ground water resource in India.

It is about 77.19 Billion Cubic metres annually replinishable.

Lagoons and Backwaters

India features a vast coastline and thanks to this, a variety of lagoons and lakes have formed.

The States like Kerala, Odisha, and West Bengal have vast surface water resources in these lagoons and lakes. In these areas, the water is usually brackish. This brackish water is employed for irrigation of certain sorts of paddy, coconut, etc and therefore the water bodies are used for fishing.

State with Highest Water Resources in India

Odisha has the largest area of water resources in India with approximately 997 thousand hectares as of 2019. This state largely depends on Southwest Monsoon for its water resources. As it is a coastal state, rainfall is an important resource for its surface water and groundwater reserves.
Reference

Types of natural vegetation of North America

(1) Tropical Evergreen Rain Forests,

(2) Deciduous or Monsoon Type of Forests,

(3) Dry Deciduous Forests and Scrubs,

Semi Desert and Desert Vegetation

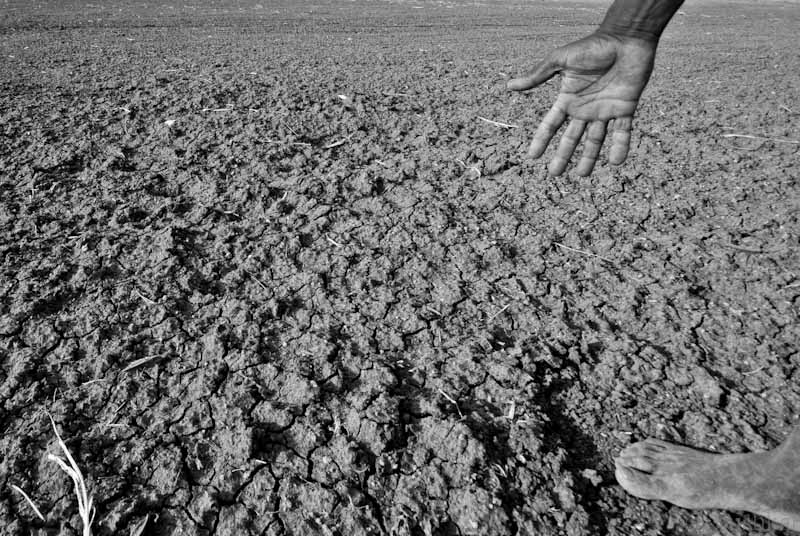
In Northern America, the desert extends from Mexico into the USA. These deserts are called by different names. For example, It is called Mohave in the Sonoran, Californian, and Mexican deserts.

Annual Precipitation in Yuma, Arizona, in the United States receives 3.3 inches of rainfall in a year. The aridity of deserts is a significant feature of the desert climate.

These hot deserts lie on the back of the Horse Latitudes or the Sub-Tropical High-Pressure Belts. Here the air is descending, which is unfavorable for any precipitation.

The rain-bearing trade Winds blow offshore and the westerlies which are onshore blow outside desert limits.

The winds that reach the deserts blow from cooler to warmer regions lose their relative humidity, which makes condensation almost impossible. Also here there clear blue sky and scarcely any clouds.

In this region, the relative humidity is less than 30% and in these, every bit of moisture is evaporated and these regions do experience permanent drought.

(5) Tidal or Mangrove Forests and (6) Mountain Forests.

Factors affecting wind speed and direction Upsc

factors affecting wind speed

Due to atmospheric pressure, the air is set in motion. This is called Wind. This wind flows from a high-pressure area to low pressure area. Apart from the air pressure, the rotation of the earth also influences the rotation of the earth.

The force exerted by the rotation of the earth is called Coriolis force or effect. Altogether, the horizontal winds nearer to the surface of the earth are affected by the three forces combined such as the pressure gradient force, frictional forces, and the Coriolis force.

Also, the gravitational force acts downward.

Factors affecting speed and direction of wind Upsc
Factors affecting speed and direction of wind By Wagner Christian – Own work, CC BY-SA 2.5, https://commons.wikimedia.org/w/index.php?curid=958801

Pressure Gradient Force

The force in the atmosphere is produced by differences in atmospheric pressure. The rate of change of pressure corresponding to the distance is called the Pressure Gradient. The Pressure gradient force causes the winds to blow.

The pressure gradient is strong when the Isobars are close and weak when the Isobars are far apart. That is, the wind blows from higher pressure to lower pressure, and also when there is a greater pressure difference, the greater is the wind speed.

The pressure gradient is perpendicular to an isobar. Also, the higher the pressure gradient, the more is the speed of the wind and also the higher is deflection in the direction of the wind. The velocity of the wind is directly proportional to the pressure gradient. That as the pressure increases a.k.a pressure gradient increases by which the speed of the wind also increases at the particular location.

The Pressure Gradient force is the one that triggers the initial movement of air.

Causes of Pressure Gradient Force

The difference in air pressure and pressure gradient is caused because of the unequal heating of the earth’s surface and the concentration of the incoming solar radiation at the equator. Also due to the energy surplus at low latitudes. Ex: Air is warm at the equator and Air is cold at the poles.

Frictional Force

The air is a fluid, the air molecules rub across the surface of the earth and the object over it such as hills, trees, etc. Also, the air above the surface faces little friction

Frictional forces influence the speed of the wind. The frictional force is greatest at the surface and it influences, generally to an altitude of 1 to 3 Km. The frictional force is minimal at the surface of the sea. Simply, the friction is greatest near the earth’s surface and it rapidly decreases with altitude or height.

The layer where the air is highly affected by the frictional force and the surface is called the boundary layer. The frictional force has two effects on the wind, first it opposes the direction of motion by acting opposite to the airflow, and second, it affects the speed of the wind.

The effect of friction is different on different terrains. On hilly terrains, winds are deflected by 30° or more. On the other hand on flat landforms, it is negligible.

Coriolis Force

Coriolis Force
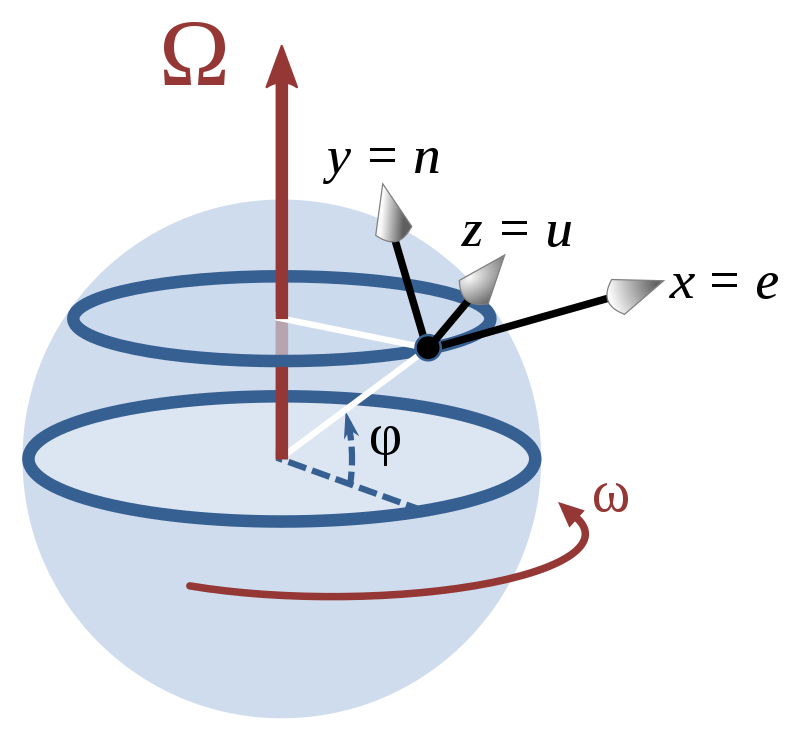
Coriolis Force By Original: Brews ohareThis Version: CheChe – This file was derived from: Earth coordinates.PNG:, CC BY-SA 4.0, https://commons.wikimedia.org/w/index.php?curid=56454820

The direction of wind is affected by the rotation of the earth about the axis. This force due to the rotation of the earth is known as the Coriolis force.

As per the French Physicist Gustave-Gaspard Coriolis, who not that the Force due to the rotation of the earth, deflects the wind to the right direction in the Northern Hemisphere and to the left in the Southern Hemisphere.

Also observed, is that the deflection is more when the velocity of the wind is high. The Coriolis forces are directly proportional to the angle of latitude and are maximum at the poles and are absent at the equator.

This force acts perpendicular to the pressure gradient force. The wind blows in the low-pressure area.

In the equator, the Coriolis force is zero, and the wind blows perpendicular to the isobars. As result, the low pressure gets filled rather than getting intensified. Due to this tropical cyclones were not formed near the equator.

Pressure

The velocity and direction of the wind are the final output of the wind-generating forces. Above 2 to 3 km above the surface of the earth, the wind is free from the frictional effect of the surface.

In such heights, winds are affected only by the Coriolis forces and pressure gradient. If Isobars are straight and if there is no friction, the pressure gradient force is balanced by the Coriolis force and wind arises out of it blowing parallel to the isobar. This wind is called Geostrophic Wind.

The wind circulation around a low is called Cyclonic Circulation and around the high is called Anti Cyclonic Circulation. The Winds direction around such a system change as per their location in Southern Hemisphere or Northern Hemisphere.

Pressure SystemPressure condition at the CentreNorthern HemisphereSouthern Hemisphere
CycloneLowAnticlockwiseClockwise
AnticycloneHighClockwiseAnticlockwise
Wind Direction Pattern in Cyclones and Anticyclone

The wind circulation at the earth’s surface around low and high, on different occasions, is closely related to the higher-level wind circulations.

Convergence and divergence of wind Source: Ncert

Over the low-pressure area, the air converges and rises. In high-pressure areas, the air will subside from above and diverge at the surface. Apart from convergence, some eddies, convection currents, orographic uplift, and uplift along the fronts cause the air to rise. This is the basic need for the formation of clouds and precipitation.

Conclusion

In these notes, we have discussed the topic ‘Factors affecting speed and direction of the wind‘ in Physical geography and the areas covered are factors and outcomes due to the speed and direction of winds. This note is extremely useful for Upsc, Tnpsc, and other government service exams.

References

Atmospheric pressure and its variation Upsc

Atmospheric pressure

There is an uneven distribution of temperature, on the surface of the earth. This is because of the heating and as a result, the air expands and gets compressed on cooling.

Due to the compression and expansion of Air, variations occur in the atmospheric pressure. This variation in atmospheric pressure is the cause of the movement of air. The air moves from a high-pressure area to low pressure area.

The atmospheric pressure also determines, when will the air rise or sink. The heat and moisture are redistributed across the planet by Winds. As a result, Constant temperature is maintained on the whole planet.

The moist is raised vertically and gets cooled to form clouds, which brings down Precipitation in form of rain or snow.

Atmospheric Pressure

Every living being on the earth is subjected to air pressure. As one moves vertically, the air pressure gets varied and one gets difficulties in breathing.

Atmospheric Pressure is defined as “the weight of a column of air contained in a unit area from the mean sea level to the top of the atmosphere.” It is expressed in the units of Milibar.

Atmospheric Pressure a sea level is 1013.2 Milibar.

The air is denser at the surface of the earth and has higher pressure due to the effect of gravity.

Atmospheric pressure and its variation
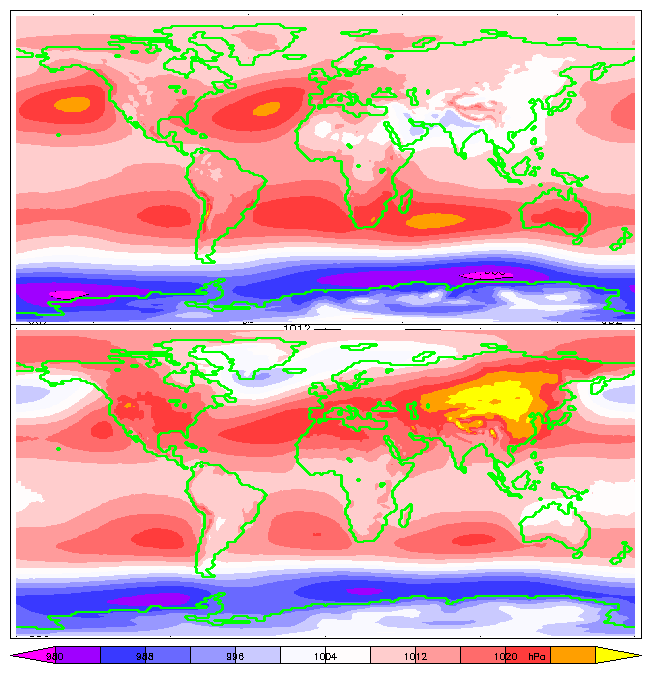
Atmospheric Pressure across the world By William M. Connolley, CC BY-SA 3.0, https://commons.wikimedia.org/w/index.php?curid=1447428

Mercury Barometer or the aneroid barometer is used to measure Air pressure.

The air pressure decreases with height and at any height or elevation, the air pressure varies from place to place and its variation is the main reason for the air motion.

As a result, the wind moves from high pressure to low-pressure regions.

Vertical Variation of Pressure

The pressure decreases rapidly with height, in the lower atmosphere. For each 10m elevation in height, the air pressure decreases by 1 Mb. This decrease in air pressure is not always constant throughout the world.

LevelPressure in MbTemperature in Celsius
Sea Level1013.2515.2
1 km898.768.7
5 km540.48-17.3
10 km265-49.7
Standard Pressure and Temperature at different levels of height

The vertical pressure gradient force is greater than the horizontal pressure gradient. But, the pressure gradient force is balanced by an equal but opposite gravitation force. As a result, we dot experience any strong upward winds.

Horizontal Distribution of Pressure

Horizontal Distribution of Pressure
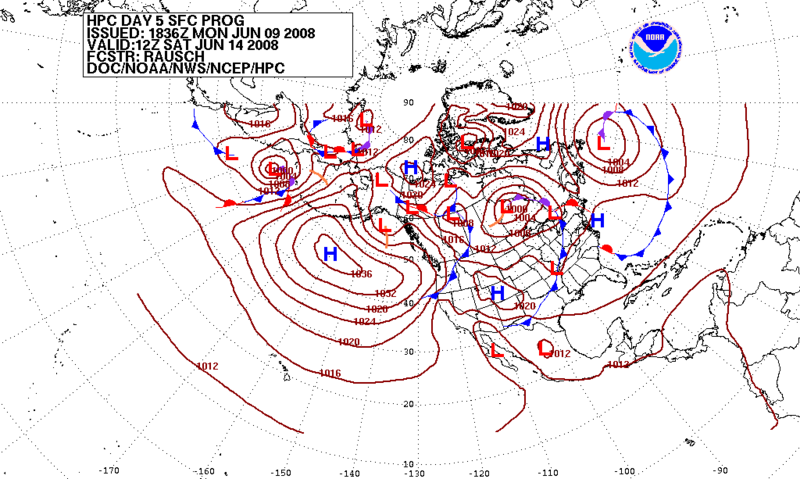
Horizontal Distribution of Pressure By Hydrometeorological Prediction Center – http://www.wpc.ncep.noaa.gov/medr/day5nav.html, Public Domain, https://commons.wikimedia.org/w/index.php?curid=37193836

The small difference in pressure is high, important in determining the wind direction and its velocity.

The horizontal distribution of pressure is studied by drawing isobars at constant levels.

Isobars

It is a line on the map that connects points have same atmospheric pressure at a given time or average period.

In order to eliminate the effect of height (altitude) on pressure, it is measured at any station after being reduced to sea level for comparison.

As seen in the above image, the patterns of the isobars are related to the pressure systems.

The Low-pressure system is enclosed by one or more isobars with the lowest pressure in the centre. The high-pressure system is also enclosed by one or more isobars with the highest pressure in the centre.

World Distribution of Sea Level Pressure

Near the equator sea level, the pressure is low. This area is called Equatorial Low. Along 30° N and 30°, S has high-pressure areas. This area is called Subtropical Highs.

Along the poles, 60° N and 60° S, these low-pressure belts area is called Sub Polar Lows. Near the Poles, the pressure is high and these areas are called Polar High.

These pressure belts are not permanent as it oscillates with respect to the movement of the Sun. The pressure belts move southwards during the winter and move northwards during the summer in the northern hemisphere.

Conclusion

In these notes we have discussed, Atmospheric pressure and its variation, such as Vertical variation and horizontal distribution, and also its worldwide distribution, with its pressure levels and belts.

References

Major crops of Tamil Nadu and its primary cultivation region

Major crops of Tamil Nadu

Agriculture is and continues to be an important sector of Tamil Nadu’s economy. Around 60% of the total population of the state is engaged directly or indirectly in agriculture and its allied sectors. Tamil Nadu has around seven agro-climatic conditions and different soil conditions. That is suitable for the growth of Food crops, Species, Horticulture, Medicinal, and Aromatic plants.

But altogether, the major crop of Tamil Nadu is Paddy, millet, a variety of Pulses, different oil seeds, and Sugarcane. Also, different cash crops and tea plantations are also there.

Paddy

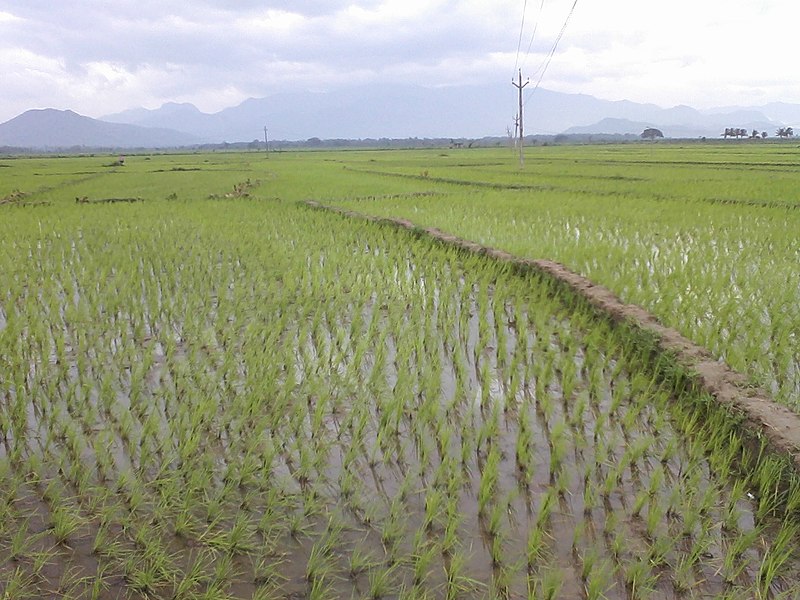
Rice field in Tamil Nadu By Jeevan naidu – Own work, CC BY-SA 4.0, https://commons.wikimedia.org/w/index.php?curid=62063761

It is the most important staple food crop of Tamil Nadu. The major variety of paddy grown in Tamil Nadu is Ponni and Kichadi.

Rice cultivation in the state is 3 Million Hectares. Paddy cultivation is concentrated in Thanjavur, Tiruvarur, Tiruvallur, Kancheepuram, Villupuram, Cuddalore, and Tirunelveli districts.

Tamil Nadu Ranks is third in India. The Cauvery delta of Thanjavur district (Undivided) is the major rice production region of Tamil Nadu. As a result, the Cauvery delta is called the Granary of Tamil Nadu.

Millets

Millet Cultivation in Tamil Nadu By Thamizhpparithi Maari – Own work, CC BY-SA 3.0, https://commons.wikimedia.org/w/index.php?curid=17896698

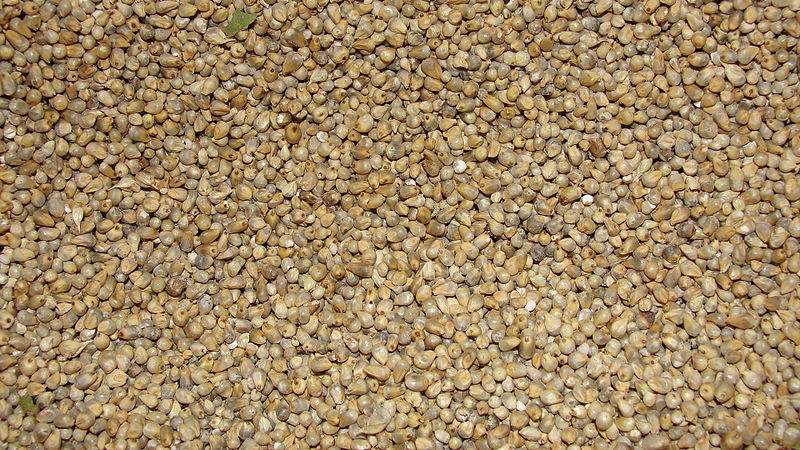
Millets are stable food for 1/3 of the population of Tamil Nadu. Major millets are Sorghum/Jowar (Cholam), Ragi (Kezhvaragu), and Bajra (Kambu).

Millets are grown in drier areas as well as coastal plains. Sorghum is cultivated in the Coimbatore plateau and Kambam Valley.

Ragi is grown in cultivated Dharmapuri, Vellore, Coimbatore, and Cuddalore districts. Bajra is grown in Ramanathapuram, Tirunelveli, Karur, Perambalur and Salem Districts.

India observed 2018 as the National Year of Millets.

FAO decided to observe 2023 as the International Year of Millets.

Pulses

Pulses in Tamil Nadu By Monali.mishra – Own work, CC BY-SA 4.0, https://commons.wikimedia.org/w/index.php?curid=40862359

Pulses are the main source of protein in India for the Vegetarian Population. Major pulses grown in India are Bengal Gram, Black Gram, Green Gram, Cow Pea, and Horse Gram.

Pulses are grown mostly in drier regions with or without irrigation. A mild Cool Climate and low to moderate rainfall are optimal for Pulse cultivation.

It also serves as excellent fodder for animals. Pulses are grown in almost all the districts of Chennai, Nilgiris, and Kanyakumari.

Coimbatore tops in the production of Bengal Gram. Vellore and Kanyakumari district’s products are Red Gram.

Tiruvarur, Nagapattinam, and Thoothukudi districts are principal producers of green gram and black gram.

Horse gram is widely cultivated in Dharmapuri and Krishnagiri districts.

National Project On Organic Farming

To promote organic farming a central scheme named National Project on Organic Farming. The scheme provides financial assistance through a capital investment subsidy scheme.

Oil Seeds

Oil seed cultivation in Tamil nadu By I, Avenafatua, CC BY-SA 3.0, https://commons.wikimedia.org/w/index.php?curid=2252388

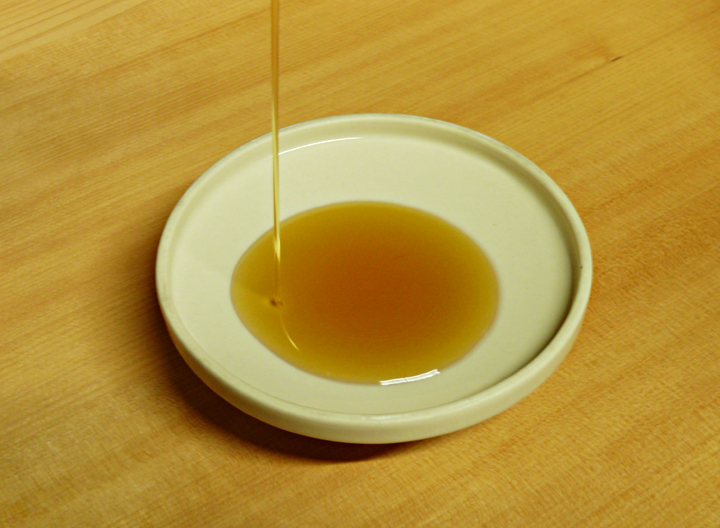
Oilseeds grown in Tamil Nadu are Groundnut, gingelly, castor, coconut, sunflower, and mustard. The oil is used for cooking.

Industrial applications of oil are used for Lubrication and making Varnish, Soaps, Candle, cosmetics, pharmaceuticals,

Groundnut is a major oilseed of Tamil Nadu. Groundnut cultivation is concentrated in Vellore, Tiruvannamalai, Villupuram, Salem, and Pudukottai districts.

Groundnut is also grown in Dharmapuri, Cuddalore, Perambalur, and Madurai. Erode, Ramanathapuram, Sivagangai, and Virudhunagar districts are minor producers.

Coconut which is also used to produce Oil is grown in Coimbatore, Thanjavur, and Kanyakumari districts.

Sugarcane

Sugarcane cultivation in Tamil Nadu By Rufino Uribe – caña de azúcar, CC BY-SA 2.0, https://commons.wikimedia.org/w/index.php?curid=1155927

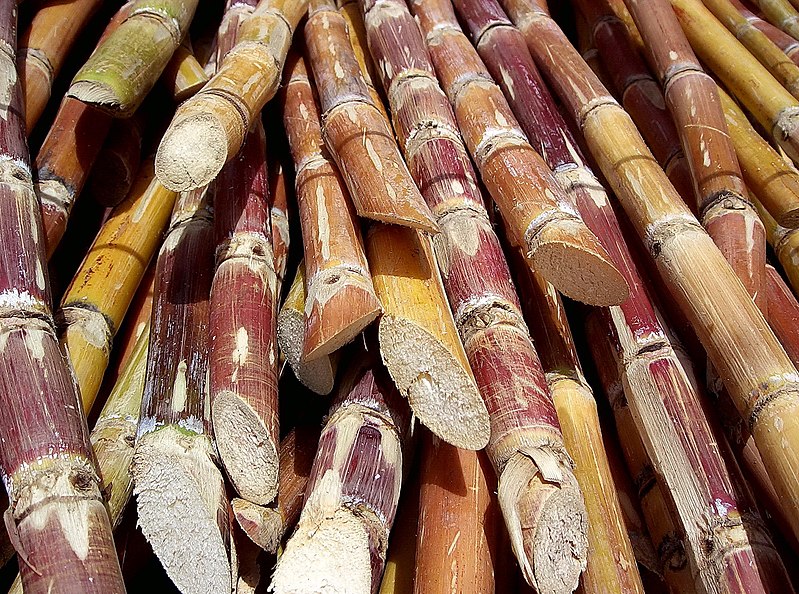
The major cash crop of Tamil Nadu is Sugarcane. It needs high temperatures and heavy rainfall.

Sugarcane grows well in tropical regions. Tiruvallure, Kancheepuram, Vellore, Cuddalore, Tiruchirapalli, Coimbatore, Erode, and Tirunelveli are major sugarcane-producing districts.

Cotton

Cotton cultivation in Tamil nadu By Azzurro – Own work, CC BY-SA 3.0, https://commons.wikimedia.org/w/index.php?curid=1316365

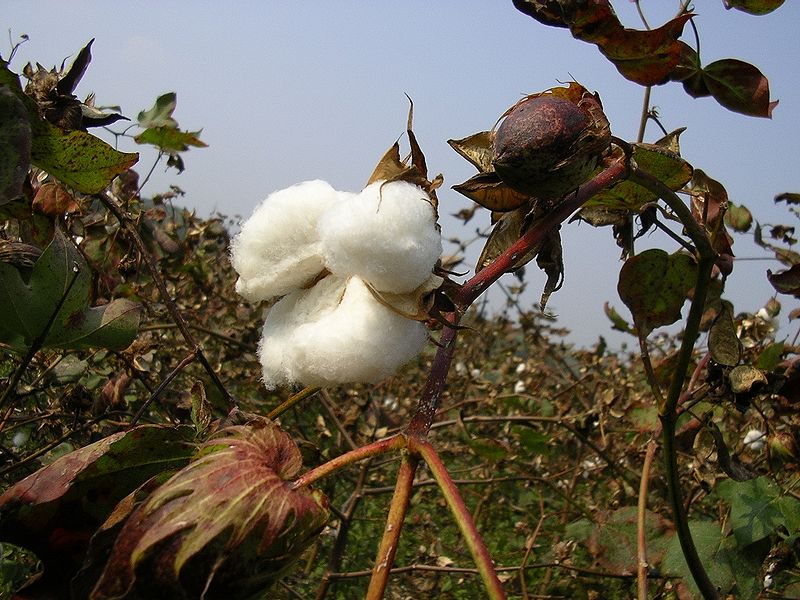
Cotton is a fibre crop and it is also a cash crop. It requires black soil, long frost-free conditions, and warm and humid weather. It needs Humid weather in the early stages and hot, dry weather during the harvest period.

Cotton is mostly cultivated in the Coimbatore plateau and Vaigai-Vaippar river basins. It is also cultivated in Madurai, Ramanathapuram, Virudhunagar, Tirunelveli, Thoothukudi, Salem, and Dharmapuri districts.

Plantation crops

Plantation crops in Tamil Nadu By © 2011 Jee & Rani Nature Photography (License: CC BY-SA 4.0), CC BY-SA 4.0, https://commons.wikimedia.org/w/index.php?curid=37837333

Major plantation crops of Tamilnadu are Tea, Coffee, Cashew, rubber, and Cinchona. In Tea production, Tamilnadu ranks second in area and production. First in tea production in Assam.

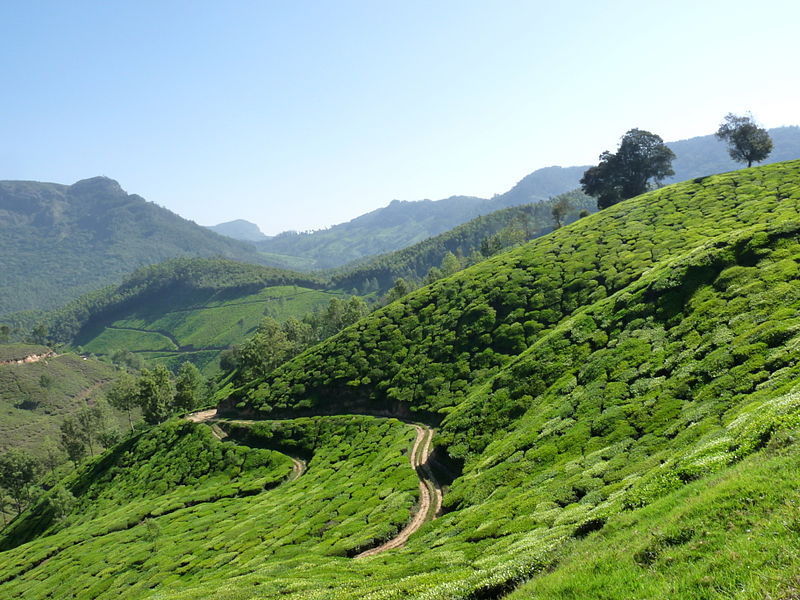
Tea plantations are found in the Hills of Nilgiris and Coimbatore. The Nilgiris is an important region for tea plantations.

Coffee plants are grown in the hills of Western and Eastern Ghats. Coffee plantations are found in the hilly slopes of the Dindigul, Madurai, Theni, and Salem districts.

Coffee plantations are also found minor on the slopes of Yercaud, Kolli Hills, and Kodaikanal. Tamil Nadu is second in coffee production in India. The first is Karnataka.

Rubber plantation is an important Plantation crop, concentrated in the Kanyakumari district. Pepper is another plantation crop that needs warm and wet slopes, so it is grown in the Eastern and Western Ghats of Tamil Nadu.

Cashew is largely cultivated in the Cuddalore district. Cinchona is planted at heights varying from 1060 to 1280 metres in Anaimalai Hills.

Cardamom estates are found in the hills of Madurai Regions at an elevation of 915 to 1525 metres.

TANTEA – (Tamil Nadu Tea Plantation Corporation Limited)

It is one of the largest Black Tea Producer in India with High-quality clonal tea. With a Plantation that spread over 4500 Hec.

Tamil Nadu Dairy Development Corporation Ltd

Tamil Nadu Dairy Development Corporation Ltd was transformed into Aavin that is Tamil Nadu Co-operative Milk Producers Federation Limited.

Conclusion

The major crops grown in Tamilnadu are rice, ragi, maize, pulses, sugarcane, etc.

Major dams in Tamilnadu Tnpsc

Mettur Dam

Mettur Dam
Mettur Dam By Saravankm – Own work, CC BY-SA 4.0, https://commons.wikimedia.org/w/index.php?curid=36433904

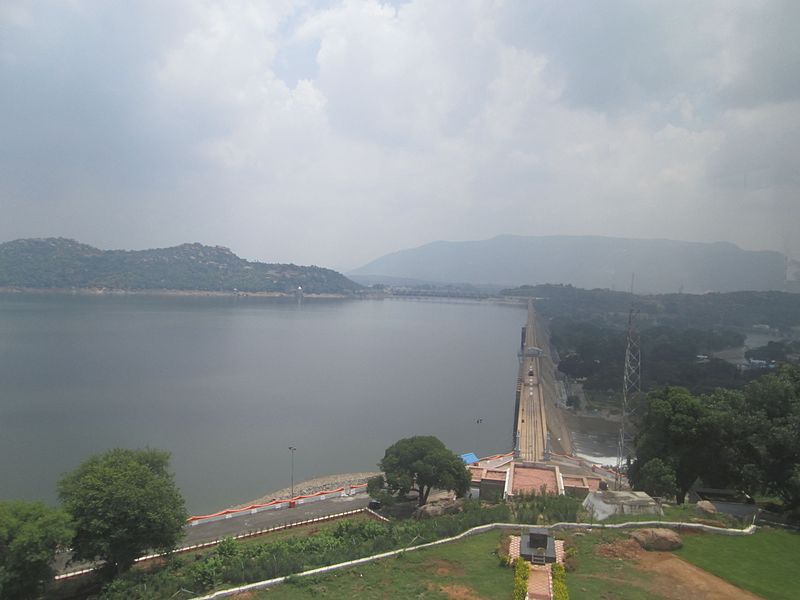
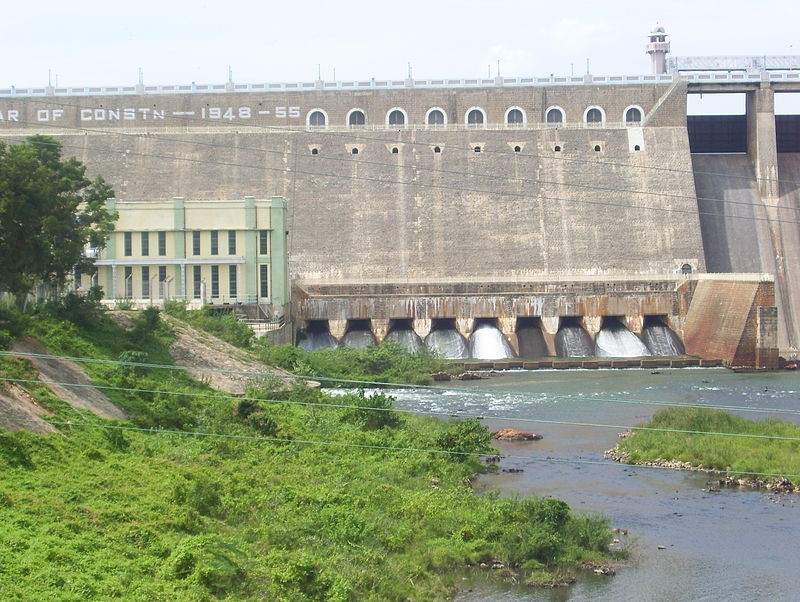
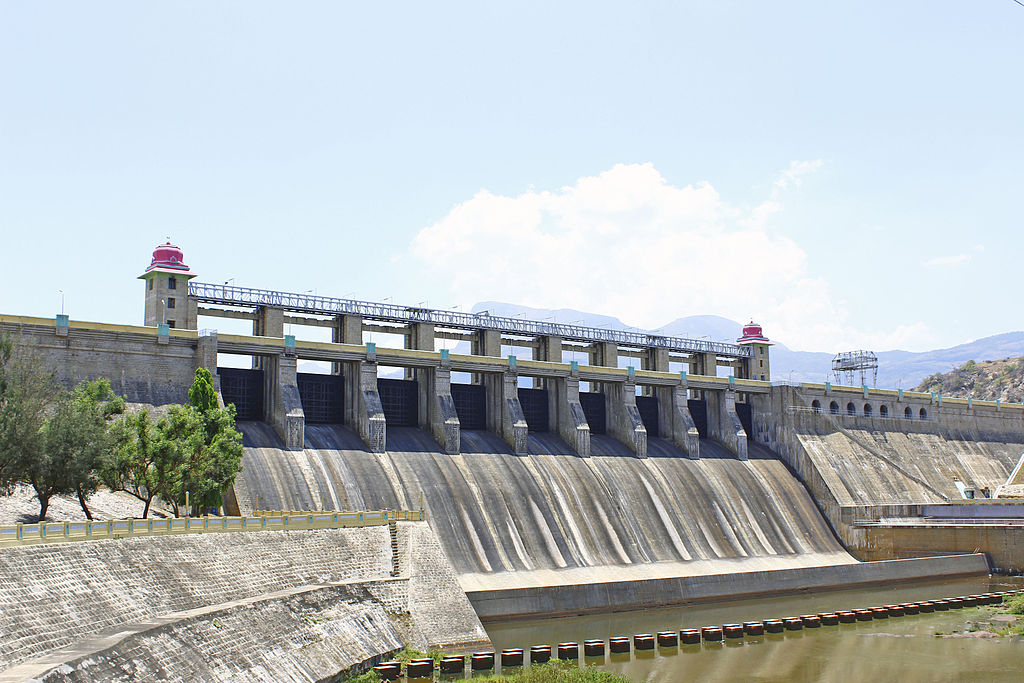
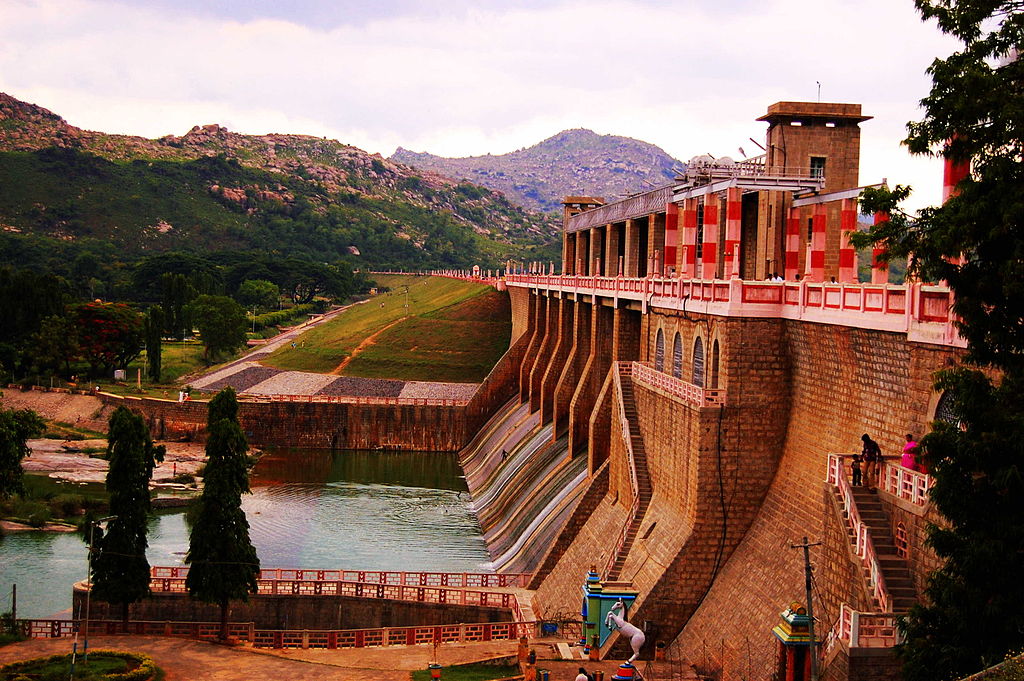
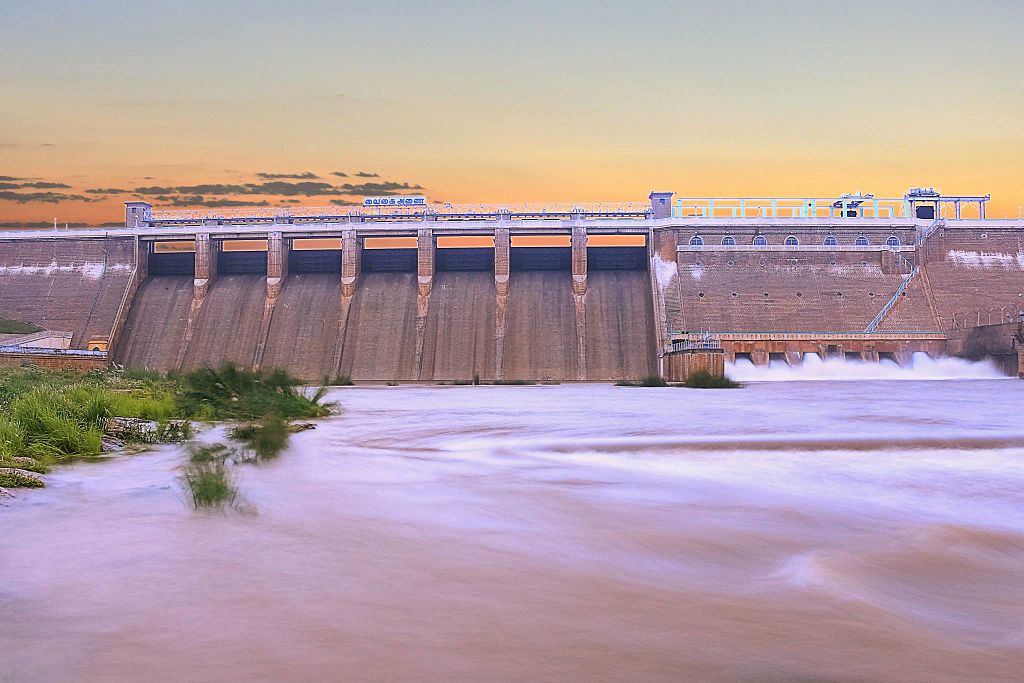
The Mettur Dam was constructed in a gorge, where the river Cauvery enters the plains. Mettur Dam is one of the oldest dams in India. It provides irrigation to Salem, erode, karur, tiruchirappalli, thanjavur, tiruvarur and Nagapattinam.

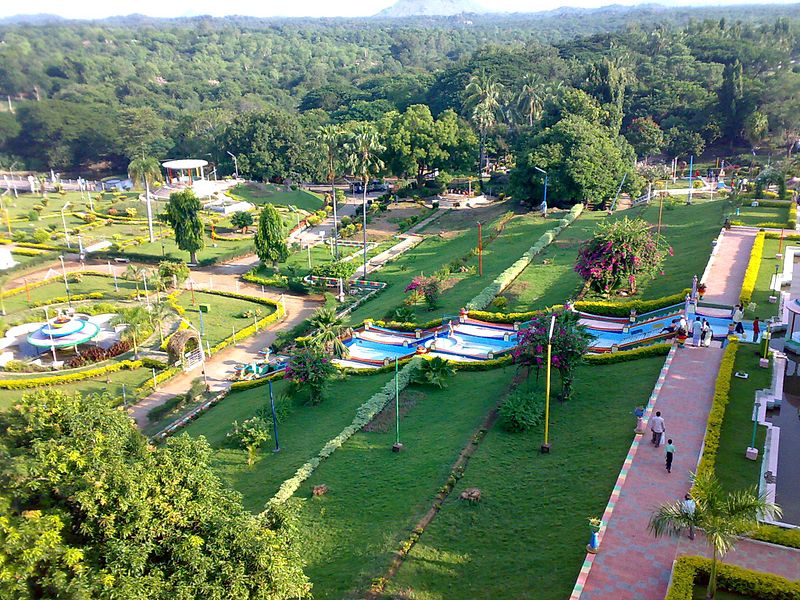
It irrigates 2,71,000 acres of farms. It also serves as a Park, Major Hydroelectric power stations, and important tourist spots.

Bhavani Sagar Dam

Bhavani Sagar Dam
Bhavani Sagar Dam By Pratheept2000 – Own work, CC BY 3.0, https://commons.wikimedia.org/w/index.php?curid=8267394

It is situated 80 km away from Coimbatore city in Erode district. This dam is constructed across the river Bhavani.

It is one of the biggest earthen dams in the country.

Amaravathi Dam

Amaravathi Dam
Amaravathi Dam By Hayathkhan.h – Own work, CC BY-SA 3.0, https://commons.wikimedia.org/w/index.php?curid=32071119

It is located 25 km away from Udumalpet in the Tirupur district. The dam is constructed across the Amaravathi, which is the Tributary of Cauvery.

This dam is primarily built for flood control and irrigation. This reservoir is famous for mugger crocodiles and also it is a tourist spot.

Krishnagiri Dam

Krishnagiri Dam By TheZionView – https://www.flickr.com/photos/thezionview/2539674209/, CC BY-SA 2.0, https://commons.wikimedia.org/w/index.php?curid=5399907

Krishnagiri Dam is a dam that spans the Thenpennai River by the village of Dhuduganahalli, located in the Krishnagiri district

It is located 7km from Krishnagiri towards Dharmapuri and drains an area of 5428 sq. km.

Sathanur Dam

Sathanur Dam Park
Sathanur Dam Park Area By Jeganila – Own work, CC BY 3.0, https://commons.wikimedia.org/w/index.php?curid=8268556

It is located across the river Thenpennai in Chengam Taluk. Sathanur Dam is in the midst of Chenaakesava hills.

It can hold 7321 million cubic feet (119 feet). It drains about 7183 hectares of land by the left canal and 905 hectares of land by the right canal.

It provides irrigation for Thandrampet and Tiruvannamalai Blocks. There is also a crocodile farm and a fish grotto in the dam. There is a good tourist spot.

Mullaiperiyar Dam

Mullaiperiyar Dam
Mullaiperiyar Dam By Rameshng at Malayalam Wikipedia, CC BY 3.0, https://commons.wikimedia.org/w/index.php?curid=12688882

Mullaiperiyar dam was built by the British Administration in 1895. It is built on the Periyar river that originates from Thekkady in Kerala.

The dam builds mainly for irrigation, which is perennially drought-prone. Most of the water is used by Tamil Nadu, even though it is located in Kerala. The height of the dam is 175 feet and 1200 in width.

Vaigai Dam

Vaigai Dam
Vaigai Dam By Lakshmichandrakanth – Own work, CC BY-SA 4.0, https://commons.wikimedia.org/w/index.php?curid=42153544

Vaigai Dam was built across the river Vaigai near Andipatti. The dam’s height is 111 feet and can store water up to 71 feet.

It is located 7 km from Andipatti and 70km from Madurai. This dam was opened on 21 January 1959.

The dam is also called Little Brindavan, for its unique garden. It is a popular picnic spot in the Theni district.

Manimuthar Dam

Manimuthar Dam
Manimuthar Dam By Rahuljeswin – Own work, CC BY-SA 4.0, https://commons.wikimedia.org/w/index.php?curid=45928788

It is located about 47 km from Tirunelveli and is built on the Tamirabarani river.

There is a beautiful garden located about 5km from the dam and it is accessible through a zig-zag ghat road. Boating and waterfall are its tourist attractions.

The Papanasam Dam

Karaiyar dam
The Papanasam Dam By Arikrishnan – Own work, CC BY-SA 3.0, https://commons.wikimedia.org/w/index.php?curid=18024371

Papanasam Dam is also known as Karaiyar dam and is located about 49km away from Tirunelveli. It is used to irrigate 34,861 hectares of land in the Tirunelveli and Thoothukudi districts.

It generates 28 MW of Hydro Power.

Parampikulam Aliyar Project

Parampikulam Aliyar Project
Parampikulam Aliyar Project By K.Mohan Raj – Own work, CC BY-SA 3.0, https://commons.wikimedia.org/w/index.php?curid=8815487

It is a joint project of Tamil Nadu and Kerala. This project proposes the construction of seven interconnected reservoirs by harnessing the water of seven rivers.

These river include Parambikulam, and Aliyar. Parappalar project is located near Ottanchatram and its storage capacity is 167 million cubic feet of water.

It is about 75 km from Madurai and is in Palani Taluk.

Temperature Inversion Upsc

Inversion of temperature in Geography

Usually, the temperature decreases as the elevation increases. It is known as the Normal Lapse Rate.

Sometimes, this situation is reversed and the Normal Lapse Rate is inverted. It is called Inversion of Temperature in Geography.

It is the rate at which an atmosphere variable, the normal temperature in the atmosphere falls with altitude. A lapse in the sense is a gradual fall. That is in the dry air, the adiabatic lapse rate is 9.8 °C/km. It refers to the vertical component of the spatial gradient of temperature. This concept is mostly applied to the earth’s troposphere.

Inversion of temperature in Geography Upsc
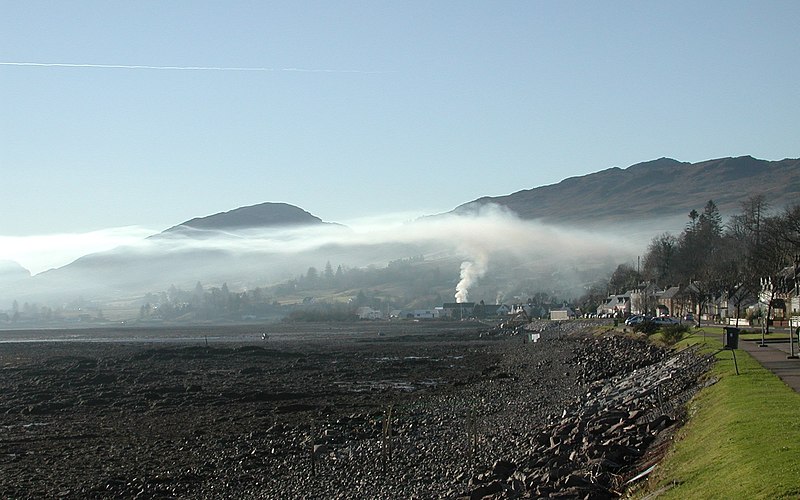
The Smoke Raising is stopped by warmer air above it due to Inversion of Temperature Scotland;Mountains;LandSea By JohanTheGhost – Photo by S/V Moonrise, CC BY-SA 3.0, https://commons.wikimedia.org/w/index.php?curid=553043

The Temperature inversion is also known as Thermal Inversion. It is a reversal of the behaviour of temperature in the Troposphere. In which the layer of cool air at the surface is overlaid by a layer of warmer air. The inversion is mostly of short duration and quite common.

“The ideal situation for inversion is long winter night with clear skies and still air.”

The day’s heat radiated off during the night. And during the early morning hours, the earth is cooler than the air above it. In polar areas, the temperature inversion is normal throughout the years.

Surface Inversion

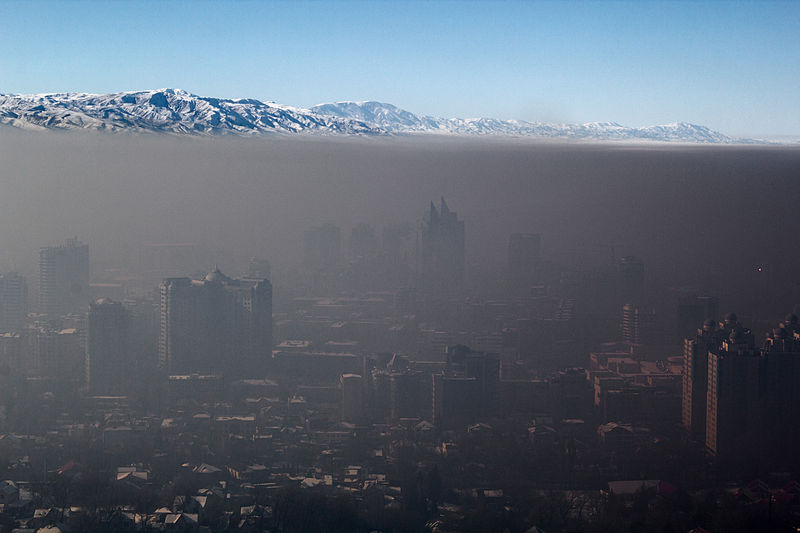
The surface inversion promotes stability in the atmosphere’s lower layers. Then the lower strata of the atmosphere are filled with smoke and dust. This smoke and dust get collected under the inversion layer and spread horizontally.

During the Winter, the dense fogs in the morning are common. It lasts for a few hours until the sun warms the earth.

Air Drainage

The Dense fog also occurs in mountains and hills because of the Air Drainage. Then the cold air from the mountains and hills, which are produced at the night flows under the effect of gravity.

The cold air is heavy and dense. It acts like water and flows down the slope to pile up deeply in valley bottoms with warm air above. This phenomenon is called Air drainage and it protects plants from frost damage.

The harmful effect of temperature inversions

May result in deadly smog concentrations. When it lasts for several days, it may cause a build-up of pollution. When this pollution is prolonged, it severely affects the health of livings beings.

Conclusion

This article is written on the topic ‘temperature inversion upsc‘. This post is referred to the Ncert Geography book.

FAQ

What is DALR?

It is the rate at which the temperature of unsaturated air, becomes saturated and behaves like dry air. DALR is almost 3°C/1000 feet

Horizontal and Vertical distribution of temperature Upsc

Distribution of Temperature

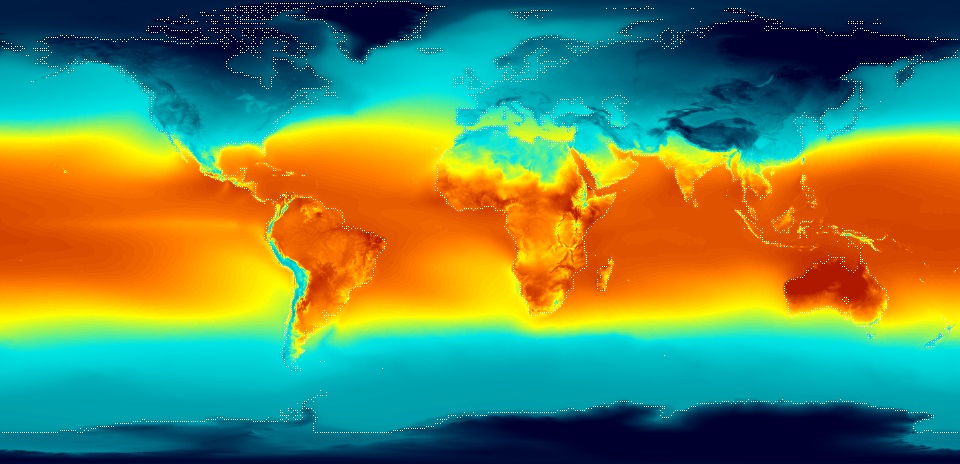
The global distribution of temperature can well be understood by studying the temperature distribution in January and July. The temperature distribution is generally shown on the map with the help of isotherms.

Isotherms geography

Isotherms geography upsc
Isotherms geography By CIA World Factbook – CIA World Factbook, Public Domain, https://commons.wikimedia.org/w/index.php?curid=531491

The Isotherms are lines joining places having an equal temperature. In general, the effect of the latitude on temperature is well pronounced on the map, as the isotherms are generally parallel to the latitude.

The deviation from this general trend is more pronounced in January than in July, especially in the northern hemisphere. In the northern hemisphere, the land surface area is much larger than in the southern hemisphere.

Hence, the effects of landmass and the ocean currents are well pronounced. In January the isotherms deviate to the north over the ocean and to the south over the continent.

This can be seen in the North Atlantic Ocean. The presence of warm ocean currents, Gulf Stream, and North Atlantic drift, make the Northern Atlantic Ocean warmer, and the isotherms bend towards the north.

Over the land, the temperature decreases sharply and the isotherms bend towards the south in Europe. It is much pronounced in the Siberian plain. The mean January temperature along 60° E longitude is minus 20° C both at 80° N and 50° N latitudes.

The mean monthly temperature for January is over 27° C, in equatorial oceans over 24° C in the tropics and 2° C – 0° C in the middle latitudes and –18° C to –48° C in the Eurasian continental interior.

The effect of the ocean is well pronounced in the southern hemisphere. Here the isotherms are more or less parallel to the latitudes and the variation in temperature is more gradual than in the northern hemisphere.

The isotherm of 20° C, 10° C, and 0° C runs parallel to 35° S, 45° S and 60° S latitudes respectively. In July the isotherms generally run parallel to the latitude. The equatorial oceans record warmer temperatures, more than 27°C.

Over the land, more than 30°C is noticed in the subtropical continental region of Asia, along the 30° N latitude. Along the 40°, N runs the isotherm of 10° C and along with the 40° S, the temperature is 10° C.

The highest range of temperature is more than 60° C over the north-eastern part of the Eurasian continent. This is due to continentality. The least range of temperature, 3°C, is found between 20° S and 15° N.

Horizontal and vertical distribution of temperature

Horizontal distribution

The distribution of temperature across the latitudes of the surface of the earth is called Horizontal distribution. The most basic horizontal temperature variation is the decrease in air temperature slowly from the equator towards the pole.

Vertical distribution

This is the distribution of temperature in the different layers of the atmosphere at the different latitudes from the earth’s surface. The temperature slowly decreases with elevation (Increase in Height).

This vertical distribution of temperature, also the pressure, density, and composition of the atmosphere constitute the atmospheric structure. The decrease in temperature with an increase in height is because the air cools as it expands into lower pressure regions, but this does not happen everywhere.

This distribution is characterized by the vertical temperature gradient γ, which is expressed in degrees per 100 m. In the troposphere, the temperature decreases with height at an average rate of 0.6° per 100 m—that is, γ = 0.6°/100 m.

That is the average rate of temperature decrease upward in the troposphere is about 6 C per km, extending to the tropopause.

Factors controlling temperature distribution

Latitude, Distribution of Land and Water, Prevailing Winds, Ocean Currents, distance from the sea, altitude, etc.

Factors controlling temperature distribution Upsc

The temperature of the air at any place is influenced by:

  • the latitude of the place;
  • the altitude of the place;
  • distance from the sea, the airmass circulation;
  • the presence of warm and cold ocean currents;
  • local aspects.

The latitude

The temperature of a place depends on the insolation received. It has been explained earlier that the insolation varies according to the latitude hence the temperature also varies accordingly.

The altitude

The atmosphere is indirectly heated by terrestrial radiation from below. Therefore, the places near the sea-level record higher temperatures than the places situated at higher elevations.

In other words, the temperature generally decreases with increasing height. The rate of decrease of temperature with height is termed the normal lapse rate. It is 6.5°C per 1,000 m.

Distance from the sea

Another factor that influences the temperature is the location of a place with respect to the sea. Compared to land, the sea gets heated slowly and loses heat slowly. Land heats up and cools down quickly.

Therefore, the variation in temperature over the sea is less compared to land. The places situated near the sea come under the moderating influence of the sea and land breezes which moderate the temperature.

Air-mass and Ocean currents

Like the land and sea breezes, the passage of air masses also affects the temperature. The places, which come under the influence of warm air masses experience higher temperatures and the places that come under the influence of cold airmasses experience low temperatures.

Similarly, the places located on the coast where the warm ocean currents flow record higher temperatures than the places located on the coast where the cold currents flow.

Heating and cooling of atmosphere Upsc

Heating and cooling of atmosphere

The heating and cooling of the atmosphere happen in the atmosphere in different ways. The earth gets heated due to insolation. Then it transmits the heat using the long waveform to its nearest layer of the atmosphere.

The Air which is in contact with land gets heated slowly. Also, the upper layers of the atmosphere get heated by the lower layers. This process is called Conduction.

Conduction

The Conduction takes place when two bodies of unequal temperature get in contact with each other. There occurs a flow of energy between them, in the direction from warmer to cooler body.

This transfer of energy takes place until the temperature between two bodies becomes equal or their contact is broken. Conduction is an important process in heating the lower layers of the atmosphere.

Advection vs Convection Upsc

Convection

The Air, which is in contact with the earth, rises above vertically due to heating. In heated Air is in the form of current and further transmits the heat of the atmosphere. This process of heating the atmosphere is called convection.

Convection transfer of energy is confined only to the troposphere.

Advection

The transfer of heat through the horizontal movement of air is called Advection. The horizontal movement of air is relatively more important than the vertical movement.

In middle latitudes, most diurnal (day and night) variations in daily weather are caused by advection alone.

In tropical regions particularly in northern India during the summer season, local winds called ‘loo’ are the outcome of the advection process.

Heating and cooling of atmosphere Upsc

Terrestrial Radiation

The insolation received by the earth is in short waves forms and heats up its surface. The earth after being heated itself becomes a radiating body and it radiates energy to the atmosphere in the long waveform.

This energy heats up the atmosphere from below. This process is known as terrestrial radiation.

The longwave radiation is absorbed by atmospheric gases, particularly carbon dioxide and other greenhouse gases. Thus, the atmosphere is indirectly heated by the earth’s radiation.

The atmosphere in turn radiates and transmits heat to space. Finally, the amount of heat received from the sun is returned to space, thereby maintaining a constant temperature at the earth’s surface and in the atmosphere.

Heat Budget of the Planet Earth

The earth as a whole does not accumulate or lose heat. It maintains its temperature.

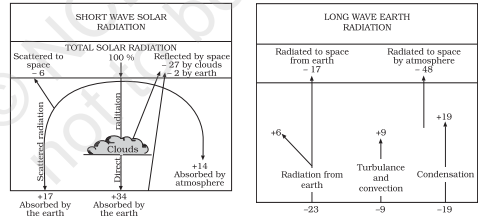
This can happen only if the amount of heat received in the form of insolation equals the amount lost by the earth through terrestrial radiation. Consider that the insolation received at the top of the atmosphere is 100 per cent.

While passing through the atmosphere some amount of energy is reflected, scattered, and absorbed.

Only the remaining part reaches the earth’s surface. Roughly 35 units are reflected back to space even before reaching the earth’s surface. Of these, 27 units are reflected back from the top of the clouds and 2 units from the snow and ice-covered areas of the earth.

The reflected amount of radiation is called the albedo of the earth. The remaining 65 units are absorbed, 14 units within the atmosphere and 51 units by the earth’s surface.

The earth radiates back 51 units in the form of terrestrial radiation.

Of these, 17 units are radiated to space directly and the remaining 34 units are absorbed by the atmosphere (6 units absorbed directly by the atmosphere, 9 units through convection and turbulence, and 19 units through latent heat of condensation).

48 units absorbed by the atmosphere (14 units from insolation +34 units from terrestrial radiation) are also radiated back into space.

Thus, the total radiation returning from the earth and the atmosphere respectively is 17+48=65 units which balances the total of 65 units received from the sun.

This is termed the heat budget or heat balance of the earth. This explains, why the earth neither warms up nor cools down despite the huge transfer of heat that takes place.


Variation in the Net Heat Budget at the Earth’s Surface

As explained earlier, there are variations in the amount of radiation received at the earth’s surface.

Some part of the earth has a surplus radiation balance while the other part has a deficit.

The figure shows that there is a surplus of net radiation balance between 40 degrees north and south and the regions near the poles have a deficit.

The surplus heat energy from the tropics is redistributed polewards and as a result, the tropics do not get progressively heated up due to the accumulation of excess heat, or the high latitudes get permanently frozen due to excess deficit.

FAQ

Conduction in geography?

The earth is heated by insolation and then the earth transmits the heat to the atmosphere layers in form of the long waves. The air in contact with land gets heated gradually and the upper layers in contact with the lower layers get heated too. This over process is known as Conduction.

References

* * All the Notes in this blog, are referred from Tamil Nadu State Board Books and Samacheer Kalvi Books. Kindly check with the original Tamil Nadu state board books and Ncert Books.