- The current population of India is 1,363,413,725 as of Feb 19, 2019, based on the latest United Nations estimates.
- • India’s population is 17.74% of the total world population.
- • India ranks number 2 in the list of countries (and dependencies) by population.
- • The population density in India is 455 per Km2.
- • 33.6 % of the population is urban (460,249,853 people in 2019)
Category: Civil Services Exam
Factors Affecting population distribution and density
Physical factors affecting population distribution
Relief
Rough mountains and hills are unsuitable for the construction of highways, railways, and agriculture because of the short growing season,
The lack of cultivable land and snowy winters do not encourage population settlement. The mountainous areas do not support a large population.
On the other hand, the low lands or plains such as Areas of Rivers Ganga, Brahmaputra, etc. in India, Hwang-Ho in China, and plains of North-Western Europe and the USA support a high concentration of population.
This is because river plains or flat level land are fertile and provide favourable conditions for agriculture, long growing season,s and suitable condition for the settlements.
Accessibility
Well-connected areas with railways, roads, shipping, canals, air transport are densely populated.
In earlier times most of the Islands remained virtually uninhabited due to the absence of water transport. The mountain regions are less populated because of the lack of accessibility.
Adequate water supply
Water has great influence over the population distribution of any region. The water supply is basic for human and life survival.
The area with a good water supply naturally or artificially has a dense population compared to the drier areas.
Great North India plains with hundreds of rivers support dense population and where are drier or drought-prone regions such as deserts regions, example Sahara, support less population.
Soil
Fertile alluvial soil found along the river valley around the world supports dense population settlement. This is fertile soil supports agricultural activities.
The world’s most densely populated areas such as East and South East Asia is heavily dependent on fertile soil.
Examples, are the Great North India Plains of India with Ganga, Brahmaputra and its tributaries, Indus valley of Pakistan, and Hwang-Ho valley of China.
Whereas, the desert soil of the Sahara region is sparsely populated.
Economic and political factors
Unfavourable conditions such as poor economic conditions, unemployment, religious intolerance, conflicts, and wars do not favour more population.
Sex Ratio upsc
Composition of Population
- Composition of Population includes sex ratio, literacy rate, age pyramids etc.
- Sex Ratio
- The sex ratio is the ratio of males to females in a population.
Sex Ratio
- Sex ratio is the ratio of males to females in a population.
- Qatar is the number one among countries with the highest male to female ratio in the world in 2018.
- With 315 males to 100 females.
- Latvia, a former Soviet Union Country has the highest sex ratio in the world.
- There were 84.8 males for every 100 females by 2015.
- It is due to World War-2, the male population experienced a great decline.
- Also, Latvia has a high mortality rate due to alcoholism, smoking and careless driving.
- Around 80% of suicides in Latvia are committed by Men because of Unemployment and unrealized financial goals.
- Women enjoy a longer life expectancy living 11 years more than men in Latvia.
- Qatar is the number one among countries with the highest male to female ratio in the world in 2018.
- As per Global sex ratio of 2014, sex ration at birth is estimated at 107 boys to 100 girls (1000 boys per 934 girls).
Sex Ratio in India
- The sex ratio of India is 933 females for every 1000 males according to the 2011 report.
- Kerala has the highest sex ratio in the country with 1084 females for 1000 males followed by Puducherry with 1037 females for 1000 males.
- Tamil Nadu with 996 females for 1000 males.
Cisgender
Cisgender is often abbreviated to simply CIS. It is the term for people whose gender identity matches the sex that they were assigned at birth. It is the opposite of the term transgender.
Population terms and concepts
Population
A group of individuals of the same species that occupies a particular geographic area.
People
The member of a particular nation, community, or ethnic group
Crude Birth Rate or Natality Rate
The number of live births per thousand people in a year.
Net Migration Rate
N = 1000 × (I – E) / P
N- Net Migration Rate
E- Number of People emigrating out of the country
I- Number of people immigrating into the country
P-estimated mid-year population
Fertility Rate
The number of live births expected per 1000 women in their lifetime in a specific geographic area and specific point of time, that is usually a calendar year.
Niger has the highest fertility rate of 6.49. Singapore has the lowest fertility rate of 0.83.
Dependency Ratio
Number of dependents in a population divided by the number of working-age people.
It’s a calculation which groups those aged under 15 with those over 65 years as the dependents and classifies those aged 15-64 years as the working-age population.
Growth Rate
Growth Rate = CBR – CDR +/- Net Migration Rate/ 1000.
South Sudan has the highest population growth rate of 3.83% in 2017.
Rate of Natural Increase (RNI)
Rate of Natural Increase (RNI) = CBR-CDR (No Migration)
CBR>CDR = ↑ population
RNI usually expressed as % e.g., 2% = 2/100 = 20/1000
RNI ≠ population growth if migration significant
Crude Death Rate (Mortality Rate)
Number of Deaths per thousand people in a year.
Adult Literacy Rate(ALI)
It is a statistical measure used to determine how many adults can read and write in a specific area or nation. Adult literacy is one of the factors in measuring the Human Development Index (HDI) of each nation,
Along with life expectancy, education, and standard of living. Burkina Faso has the lowest literacy rate of 21.8% (2015).
Life Expectancy Rate
Life expectancy equals the average number of years a person born in a given country is expected to live.
Monaco has the highest life expectancy rate at 89.52 in the year 2015. Chad has the lowest life expectancy rate at 49.81.
Population Concepts
Overpopulation
A situation whereby the population is considered too large for the available resources.
Under – population
A situation where the population is less than the available resources of a country.
Optimum Population
A situation where the number of people that can be supported is the same as the available resources.
Population growth rate by country
Regional division on the basis of growth rate
On the basis of the growth rate of a population the world can be divided into the following three types of areas:
Areas of Low Growth Rate
Developed countries like the US, Canada, Japan, Australia, New Zealand, and countries of western Europe have a low growth rate of population in these countries is due to low birth rates and low death rates. The difference between the birth rate and the death rate in these countries is the lowest.
Areas of Moderate Growth Rate
This category includes the developing countries like Pakistan, Afghanistan, Brazil, Bolivia, Mongolia, Indonesia, and many other Africa and South American countries, where the growth rate of nearly 2 % is also included among these countries though the growth rate here has started declining.
Areas of High Growth Rate
Countries like Mexico, Iran, Colombia, Venezuela, Peru, Libya, Algeria, Sudan, Kenya, and Kuwait make this category.
In fact, most of the African countries with a growth rate of 3% fall in this category.
World population growth causes and consequences
When agriculture was introduced about 8000 to 12000 years ago, the population was small, roughly about 8 million.
In the first century (C.E) it was below 300 million.
Causes of Population Explosion
World trade expanded during the 16th and 17th centuries, setting the stage for rapid population growth.
During, the dawn of the Industrial revolution around 1750, the World population was around 550 Million.
The world population exploded in the 18th after the Industrial Revolution.
Technological advancement reduced the death rate and provided the stage for accelerated population growth.
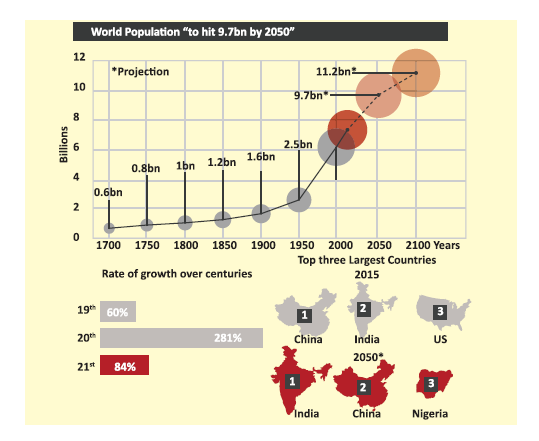
As per the current trends of the world, the population is expected to reach 8.6 billion in 2030, 9.8 billion in 2050, and 11.2 billion in 2100, as per the UN report.
The current world population is 7.6 billion.
Approximately 83 million people are added to the world population every year, and this upward trend will continue and even assuming that the fertility level will continue to decline.
The current world population, according to the UN Department of Economic and Social Affairs, in Feb 2019, the population is 7,685,036,620.

The new projections include some notable findings at the country level. China (with 1.4 billion inhabitants) and India (1.3 billion inhabitants) remain the two most populous countries,
comprising 19% and 18% of the total global population respectively. In roughly seven years, or around 2024, the population of India is expected to surpass that of China.
Among the ten largest countries worldwide, Nigeria is growing the most rapidly.
Consequently, the population of Nigeria, currently the world’s 7th largest, is projected to surpass that of the United States and become the third-largest country in the world shortly before 2050.
Most of the global increase is attributable to a small number of countries.
From 2017 to 2050, it is expected that half of the world’s population growth will be concentrated in just nine countries: India, Nigeria, Congo, Pakistan, Ethiopia, the United Republic of Tanzania, the United States of America, Uganda and Indonesia (ordered by their expected contribution to total growth).
The group of 47 least developed countries (LDCs) continues to have a relatively high level of fertility, which stood at 4.3 births per woman in 2010-2015.
As a result, the population of these countries has been growing rapidly, at around 2.4 % per year.
Although this rate of increase is expected to slow significantly over the coming decades, the combined population of the LDCs, roughly one billion in 2017, is projected to increase by 33 % between 2017 and 2030, the world population will reach 9.7 billion in 2050.
Similarly, Africa continues to experience high rates of population growth. Between 2017 and 2050, the populations of 26 African countries are projected to expand to at least double their current size.
The concentration of global population growth in the poorest countries presents a considerable challenge to governments in implementing the 2030 Agenda for Sustainable Development, which seeks to end poverty and hunger, expand and update health and education systems, achieve gender equality and women’s empowerment, reduce inequality and ensure that no one is left behind.
Population in the world is currently ( 2019) growing at a rate of around 1.09% per year (down from 1.12% in 2017 and 1.14% in 2016).
It is estimated to reach 1% by 2023, less than 0.5% by 2052, and 0.25% in 2076.
In 2100, it should be only 0.09% or addition of only 10 million people to a total population of 11.2 billion. The world population will, therefore, continue to grow in the 21st century.
Doubling Time of population
Doubling time is the amount of time it takes for a given quantity of population to double in size at a constant growth rate.
We can find the doubling time for a population undergoing exponential growth by using the Rule of 70.
It is because the population of a country becomes double in 70 years if the growth rate is 1%.
Thus, we divide 70 by the growth rate and we get the doubling time of population growth rate.
For example, if the growth rate is 2.08, divide 70 by 2.08 and we get 33.6 years as the doubling time of population.
World population has doubled in 40 years from 1959 ( 3 billion) to 1999 ( 6 billion).
It is now estimated that it will take another nearly 40 years to increase by another 50% to become 9 billion by 2037.
The latest world population projections indicate that the world population will reach 10 billion persons in the year 2055 and 11 billion in the year 2088.
World Population Milestones
According to the United Nations, the 6 billion figure was reached on October 12, 1999 (celebrated as the Day of 6 Billion).
The world population reached 7 Billion on October 31, 2011.
The current world population is 7.7 billion as of Feb 2019 according to the most recent United Nations estimates.
The United Nations projects the world population to reach 8 billion in 2023 and 10 billion in the year 2056.
Current events for Tnpsc Group 4
What are Current events?
Current events include important political or social events that happen right now. Also, it includes those events and issues of interest currently found in the news.
What are the topics to cover in current events for the Tnpsc, Upsc and other service exams?
- History – Revenue system, Land reforms
- Index and Indices
- British Acts in India
- Freedom Movement/Organization
- Indus valley sites
- Ashoka Inscriptions
- Buddism and Jainism
- Gupta, Delhi Sultanate Administration
- Medieval Architecture
- Bakti Movement -Saints, Poets
- Medieval Music, Arts
- National Parks/Sanctuaries
- Government schemes
- Rives passing through important geographical, National parts and historical sites
- Poverty
- Global Warming
- Waster Management
- Ecology, Food Chain and Food Pyramids
- IUCN Animals & locations
- Sea & Bordering countries in News
- Rivers & Glaciers
- Conventions
- Agriculture – Fertilizer
- Amendments in Law
- Functions of Parliament
- Important Schedules
- Tribals in India
- UN
- Forest Acts, Wildlife Acts
- Latest Acts
- Government Commission / Committee
- Tribunals
- International Relations
- ISRO/ Defence
- Banking and Taxes
- Environmental Acts
- Rural Economic
- Centre-State Relationship
- Important bills
- Climate Change
- Important places in News.
- Fundamental rights
- Paintings
- Social revolution
- Soil, River, Plant, & Animals in News
- Latest technology in Agriculture
- Solar energy
- Foreign Travellers
- The revolt by tribes, Farmers
- President of India
- Festival, Arts, Culture of North East
- Food safety and security
- Child/ Women’s rights
- Ancient laws/ practices
- Inflation
- RBI
The above topic are repeated in Tnpsc and Upsc for several years. These are areas one could focus on both static and current affairs.
The best publisher for currents affairs for Tnpsc, Upsc
- Pratiyogita Darpan
- Competition Success
Current Events 2021
Current Events 2022
Human resource development in India Upsc

Human Resource Development
The term ‘Human Resource Development or HRD’ is used in different contexts and with various meanings. According to F.H.Harbison, human resources are “the energies, skills, talent, and knowledge of people which are, or which potentially can or should be applied to the production of goods or the rendering of useful services”.
In Human Resource Management, HRD is defined as “organized learning activities arranged within an organization in order to improve performance and/or personal growth for the purpose of improving the job, the individual and/or organization”.

HRD includes the areas of training and development, career development, and organization development.
The most important indicators of HRD are classified into:
- Those which measure a country’s stock of human capital,
- Those which measure the additions to this stock.
This is the rate of human capital formation over a specified period. The stock of human capital indicates the level of HRD in a country, and the rate of human capital formation indicates its rate of improvement.
Human capital means an individual by investing in the following categories can improve his capabilities. They are:
- health facilities and services
- on–the–job training (including apprenticeship)
- formal education,
- study programmes for adults (e.g., Non-formal education) and extension programmes in agriculture, migration of individuals and families in search of jobs.
Earlier, the economist thought that the economic growth of a nation could be developed only by increasing investment in Physical capital. But later, during the 1960s, economists realized investment in human capital is as important as investing in Physical capital.
Example: Tamil Nadu does have a large number of Billionaires or Large Corporations but it is the second-largest economy in India and it is eyeing 1 Trillion USD GDP by 2030. This is because Tamil Nadu invested a lot in Human Capital such as Schools and College Education especially in the field of Medical and Engineering.
The state’s literacy is 80.33% in 2011 is above the Nationals average and 100% Gross Enrollment Ratio (GER) in primary and upper primary education. For all the states Tamil Nadu and Kerala stand tall only because of their Human Capital.
Of all the factors that increase human capital, education is considered very important. For that now a separate branch is known as the Economics of Education.
Economics of Education
Its birth was announced by Schultz in 1960 in his survey on Human Capital Theory. Although great economist like Adam Smith and Marshall have already expressed their opinions on the value of education, it is only last fifty years, the economist started to apply the tools of economics to study the importance of education in the economy.
Sometimes, it is asked whether education is consumption or investment. It is generally agreed that education is both consumption and investment. Nowadays, economists treat it mostly as an investment.
Harbison and Myers have given the following as human resource indicators. They are :
- Number of teachers (first and second levels) per 10,000 population ;
- Engineers and scientists per 10,000 population ;
- Physicians and dentists per 10,000 population.
- Pupils enrolled at first–level (primary) education as a percentage of the estimated population aged five to fourteen inclusive ;
- The adjusted school enrollment ratios for the first and second levels combined.
- Pupils enrolled on second level (secondary) education, as a percentage of the estimated population aged fifteen to nineteen inclusive
- Enrollment in third–level (higher education) as a percentage of the age group twenty to twenty-four.
The first three indicators i.e Teachers, Engineers, Scientists, Physicians, and dentists are used for measuring the stock of human resources. The last four indicators are measures of additions to the stock.
The following two indicators tell us about the orientation of higher education :
- The percentage of students enrolled in scientific and technical faculties in a recent year
- The percentage of students enrolled in the faculties of humanities, fine arts, and law in the same year.
Harbison and Myers constructed a simple composite index of HRD by taking the arithmetic total of:
- enrolment at the second level of education as a percentage of the age group fifteen to nineteen, adjusted for length of schooling
- enrolment at the third level of education as a percentage of the age group, multiplied by a weight of 5.
Harbison and Myers have given more weightage to higher education than second-level education. Based on the composite index of HRD, Harbison and Myers classified countries into:
- Underdeveloped
- Partially developed
- Semi-advanced
- Advanced.
HRD and Economic Development
There is a close relationship between the indicators of HRD and indicators of economic development. The level of economic development can be studied by making use of the following indicators:
- Gross National Product (GNP) per capita in United States dollars
- Percentage of the active population engaged in agricultural occupation
- Public expenditures on education as a percentage of national income; and
- The percentage of the total population in the age group five to fourteen inclusive.
The findings of an important study by Harbison and Myers reveal:
- There is a very high positive correlation between the composite index of HRD and G.N.P. per capita in U.S. dollars
- There is a high negative correlation between the composite index and the percentage of the active population engaged in agriculture.
- There are also high correlations between the adjusted second-level enrolment ratio and GNP and the percentage engaged in agriculture.
- Correlations between the first level enrolment ratio and GNP and percentage in agriculture are lower than the correlations of either the composite index or the second level enrolment ratio with GNP and percentage in agriculture.
This shows that an index based on higher levels of education correlates more significantly with measures of economic development than one based on the lowest level of education. While evolving strategies for HRD, the government has to make some basic choices. Such as:
- It has to decide informal education whether the emphasis should be on quantity or quality. In secondary and higher education,
- It has to decide whether priority should be given to science and technology or law, arts and humanities ;
- It has to decide in skill development whether the reliance should be placed on pre-employment formal training or in-service training ;
- It has to decide whether incentives should be provided by manipulation of wages and salaries or should be left to market prices and finally
- It has to consider the needs and desires of the individual and the needs of the State.
The choice between quantity and quality in educational development can take many forms. Some countries have to choose between education for all or high-quality secondary and university education for a smaller number of potential leaders.
There is also a choice between educating fewer students with better-qualified teachers and large numbers with unqualified teachers. In general, political and social pressures lead to an emphasis on quantity whereas rapid economic growth requires high–level manpower.
And there should be a proper balance in the development of education in science and technology and law, arts and humanities in secondary and higher education. The theories of human resource development, in a general way, refer to educational planning. They can be divided into three categories:
- Manpower approach
- Social demand approach and
- Rate of return approach.
Manpower Approach
The manpower approach to educational planning assumes that manpower with different levels and types of education is essential to attain a certain target growth rate of GNP. Then, the target is divided into different sectoral contributions to GNP.
In a given year, the GNP is divided into different sectors and manpower structure in each of the sectors is analyzed. Then the needed manpower with different levels and types of education is estimated.
Death, retirement, and migration are taken into account to estimate the necessary manpower. From the additional manpower requirements, enrolment figures are worked out. But the post–manpower forecasts proved that the estimates are far away from actual requirements.
Moreover, this approach to educational planning does not say anything about the method of financing education.
Social Demand Approach
The social demand approach for education can be studied by making use of the social rate of return analysis.
Rate of Return Approach
If we assume education as an investment, then we may look at it as individual investment and social investment. Under conditions of perfect competition, the individual investors would be undertaken if the internal rate was greater than the market rate of interest.
But today education and health are largely in the public sector. The social investment criterion is that resources are to be allocated to levels of education and years of schooling so as to equalize the marginal “social” rate of return on educational investment (Mark Blaug).
It may be noted that only pecuniary (monetary) values are taken into account while calculating the social rate of return. But the economic case for state education is generally made on the ground that external or indirect benefits of education exceed the direct personal benefits to those who are educated.
But non-pecuniary returns to education and externalities are usually left out in the estimates of the social rate of return. This is a limitation of this approach.
Conclusion
The article is written on the topic ‘Human resource development in India’ for Upsc and other state services exams. This article discussed What is Human resource, What is Human capital, What is Human resources development and its Indicators. And also discusses the importance of Education in the Economic development of the country.
A Detailed Study of Crops in India for Upsc
Crops in India
Farming in India is mostly food crops. Foods include Rice, Jowar, Wheat, Bajra, Maize, Barley, Ragi, Gram, and Tur.
Rice
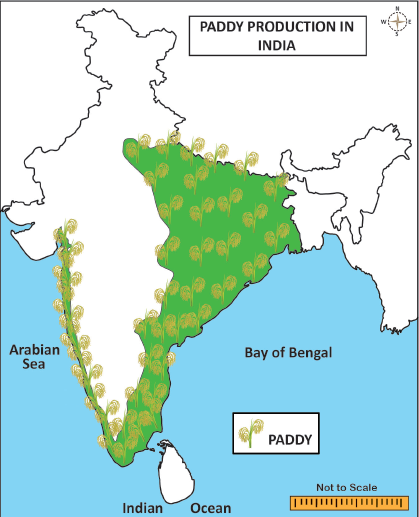
Rice is an indigenous crop in India and India is the second-largest rice producer in the world after China. It is mainly grown in tropical areas, where the mean temperature is 24 C and annual rainfall of 150 cm, and High Humidity.
Deep fertile, clay, or loamy soils suited for rice cultivation.
It is sown in three methods.
i) Broadcasting
ii) Plough or drilling
iii) Transplanting
Due to the use of HYV seeds such as CRR 451, CR Dhan 205, AR Dhan 306, etc many indigenous seeds variety disappeared.
Major Rice Producing States in India
Most rice-producing states in India are West Bengal, Uttar Pradesh, Punjab, Tamil Nadu, Andhra Pradesh, Bihar, Chhattisgarh, Odisha, Assam, and Haryana.
Wheat
A second most important crop in the country. Account for more than 22% of the total area and 34 % of the total food production grains in the country.
It requires a temperature of 10-15 degrees Celsius while sowing and 20-25 degree Celsius at the ripening time.
This rabi crop requires a cool growing season and bright sunshine at the ripening time and also it requires 50 to 75 cm of annual rainfall evenly distributed over the growing season.
The two important wheat-growing zones in Indias are the Ganga-Satluj plains in the North-West and the Black Soil Region of the Deccan.
Uttar Pradesh, Haryana, Rajasthan, Punjab, and Madhya Pradesh account for 85% of India’s wheat production. Black soil regions Deccan such as Maharashtra and Gujarat also produce Wheat.

Wheat producing states in India on map
Uttar Pradesh
This state of India produces around 35 million metric tons of wheat. Wheat is the most important food crop of the state, as result, it contributes around 32% of the total wheat production in the country.
Wheat is cultivated in around 96 Lakh hectares. And it produces around 3090 kg per hectare and the main species of wheat cultivated is Triticum aestivum.
Punjab
Punjab produces around 140 lakh metric tons of wheat, which is around 17% of India’s total wheat production. Sangrur district of Punjab produces maximum in the state of Punjab.
This state produces around 143 Kg per hectare.
Haryana
Madhya Pradesh
Rajasthan
Bihar
Gujarat
Jowar
As an Indigenous crop of Africa, it is the third most important food in India. It grows in adverse climatic conditions.
It is cheap food with a lot of nutrients such as carbohydrates, protein, minerals, and vitamins. Due to cheap prices, it is food for the poor and fodder for animals. Produced in Peninsular, Maharashtra, Madhya Pradesh, and Karnataka.
Bajra
It is from Africa and serves as the staple food for the poor and fodder for animals. Its stalks are used for thatching purposes.
It is a crop in the drying region. Largely produced in Maharashtra, Haryana, Gujarat, and Uttar Pradesh.
Barley
It is an important cereal for the poor also used to make Barley water, Beer, and Whiskey. Rajasthan and Uttar Pradesh are major Producing states.
Pulses
It is the major source of protein for vegetarians. These are mostly leguminous.
Its husk is used as fodder for cattle. These leguminous plants help to fix nitrogen in the soil usually rotated with other crops.
Madhya Pradesh, Andhra Pradesh, Uttar Pradesh, Rajasthan, and Maharashtra are major producing states.
Democratic socialism in India Upsc

When India got independence, there were many problems that the nation had to handle. One among these problems was which would be the best strategy for long-term development. Jawaharlal Nehru was the architect of planning in India.
He was inspired by the Soviet model of planning and was also inspired by the liberal principles of capitalism. He wanted to bring the two ideas together in India which was termed democratic socialism. For Nehru, democracy and planning had to go together. Planning was an integrated way to look at the needs of society.
It had to interlink production, consumption, employment, transport, education, health, social service, etc. Such a society enables the complete development of the personality of the individual. It is the responsibility of the state to direct its policy to secure a better distribution of ownership and control of the material resources of the community.
To protect the weaker sections, the state is also expected to control the distribution of essential commodities.
Democratic Socialism
Democratic socialism is having a socialist economy, where production is socially, collectively controlled or owned, along with a liberal democratic political system of government. This system rejects most self-described socialist states and Marxism-Leninism.
Nehru democratic socialism
The left politics have considered Nehru’s socialism as ‘Inadequate’ and Ring wing activists consider his Socialism as ‘Licence-Permit Raj’. Nehru’s socialism was evolutionary, inclusive and most importantly it was not based on class.
His socialism was democratic, which is committed to welfare and affirmative action. His model stressed the government to lead the public sector. He understood the value of local democracy. Also very well managed the local resources and mobilised in every possible way.
Reference