The latitude and longitude coordinates of India are 20.5937° N, 78.9629° E.
What is latitude and longitude?
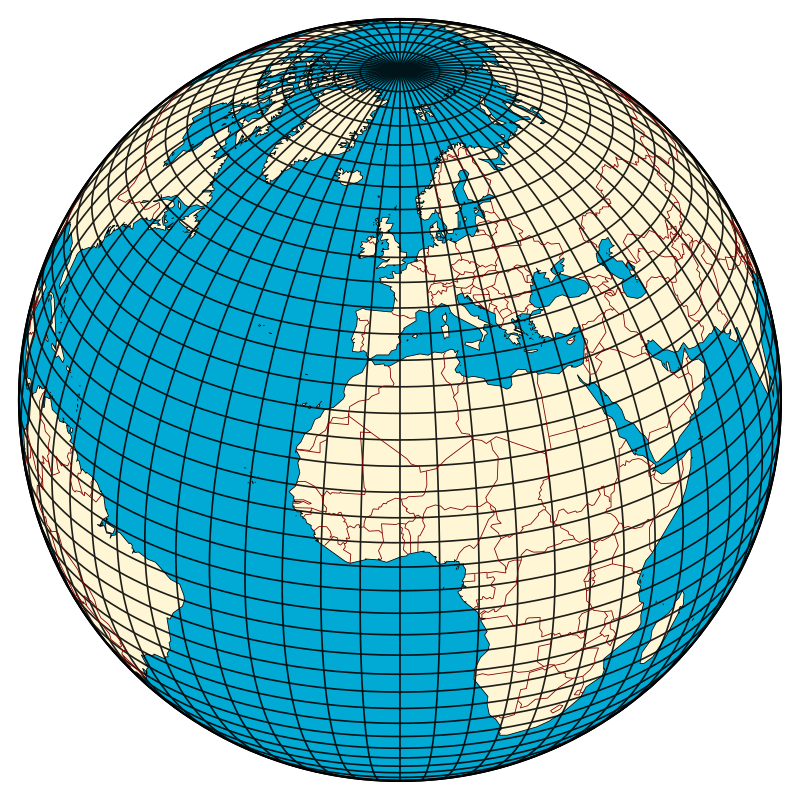
Latitude and longitude are a set of lines used to describe the location of any place on earth. The Earth is not a perfect sphere its polar radius and equatorial radius are not the same. There is bulging at the equator because of the earth’s rotation over its axis.
Therefore the shape of the earth is not a perfect sphere and it actually looks like an Oblate Spheroid. Because of its shape, there are difficulties in positioning its surface features and there is no point of reference from which to measure the relative positions of other points.
Therefore a set of lines is drawn on the map or globe to mark reference of the location of a different place on the earth’s surface. The basis of the geographical grid, formed by two natural points of reference is the North and South Pole.
The earth spins from west to east. The latitudes and longitudes are sets of horizontal and vertical lines.
The Horizontal lines are called Parallels of latitudes and Vertical lines are called the meridians of longitudes.
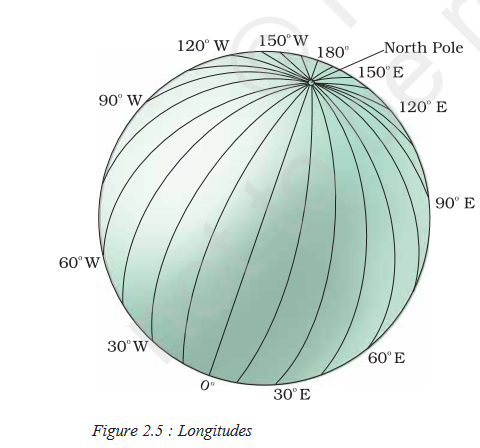
Longitudes
A set of vertical lines that join the North and South Poles are called the Meridians of Longitude. These lines converge at the poles and far apart at the equator.
Longitudes of India
India’s longitudinal extent spans from 68°7’E to 97°25’E, covering a significant east-west distance. This longitudinal stretch has several implications for India.
This longitudinal stretch has several implications for India:
Time Zones
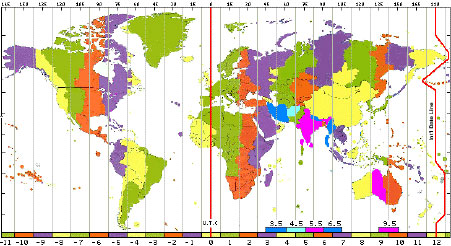
The large longitudinal extent could theoretically result in a time difference of up to 2 hours between the easternmost and westernmost points of the country. However, to maintain uniformity, India adheres to a single time zone, Indian Standard Time (IST), based on the 82.5° East longitude.
Sunrise and Sunset
Due to the longitudinal spread, the sun rises earlier in the eastern parts of India compared to the western regions. This variation in sunrise and sunset times influences daily routines and activities across the country.
Climate
The longitudinal extent can contribute to regional variations in climate, particularly in terms of monsoon patterns and temperature differences. The eastern and western coastal regions, for example, experience distinct climatic conditions due to their exposure to different ocean currents and wind systems.
Agricultural Seasons
The varying day lengths and solar radiation across different longitudes can impact the timing of agricultural seasons. Farmers in different regions may adopt different cropping patterns and irrigation practices to optimize their agricultural activities based on the local climatic conditions influenced by longitude.
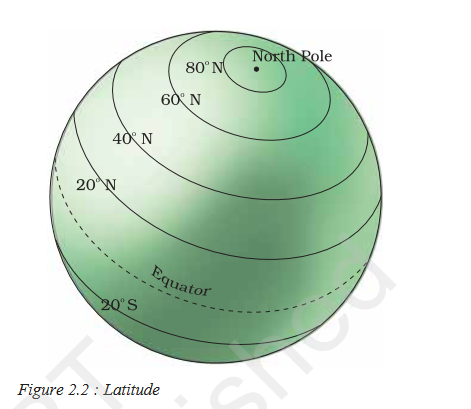
Latitudes
These lines are drawn parallel to each other in an east-west direction and the Latitude at which the earth is divided into two halves is called the Equator. The equator is also called the Great Circle, as it is the largest circle and divides the globe into two halves.
Other lines of latitudes are called Small Circle, as they are smaller than the Great Circle, and get smaller and smaller toward the poles and divide the earth into two unequal halves. All these lines of latitudes, including the Great Circle and Small Circle, are called parallels of latitude.
Latitudes of India
India’s latitudinal extent ranges from 8°4’N to 37°6’N. This means that the northernmost point of India lies at 37.6 degrees north of the equator, while the southernmost point is 8.4 degrees north.
This latitudinal extent has several implications for India:
Tropical Climate
The Tropic of Cancer, located at 23.5°N, passes through the middle of India. This contributes to the country’s predominantly tropical climate, characterized by hot and humid summers and mild winters.
Diverse Topography
India’s latitudinal extent results in a diverse range of landscapes, from the snow-capped Himalayas in the north to the tropical rainforests in the south.
Monsoon Patterns
The latitudinal position of India influences the country’s monsoon system. The seasonal reversal of winds brings rainfall to different parts of the country at different times.
Conclusion
The latitudes and longitudes are generally called Geographical coordinates because they provide a systematic network of the line by the which position of different surface characteristics of the Earth can be represented.
In the globe or map, an infinite number of Longitudes and latitudes can be drawn but only a selected number of lines are generally drawn. It is measured in degrees (°) as it represents Angular distances. Then each degree is further divided into 60 minutes ( ‘ ) and each minute into 60 seconds ( “ ).
The measurement of the degree of hotness or coldness of ocean water is referred to as ocean temperature. Temperature is normally measured in the units of degrees Celsius by thermometers. The major source of heat energy for ocean water is the radiation from the sun. Just like land, the ocean’s water gets heated up by solar energy but the process of heating and cooling the ocean is slower compared to the land.
Factors affecting ocean temperature
1.Latitude
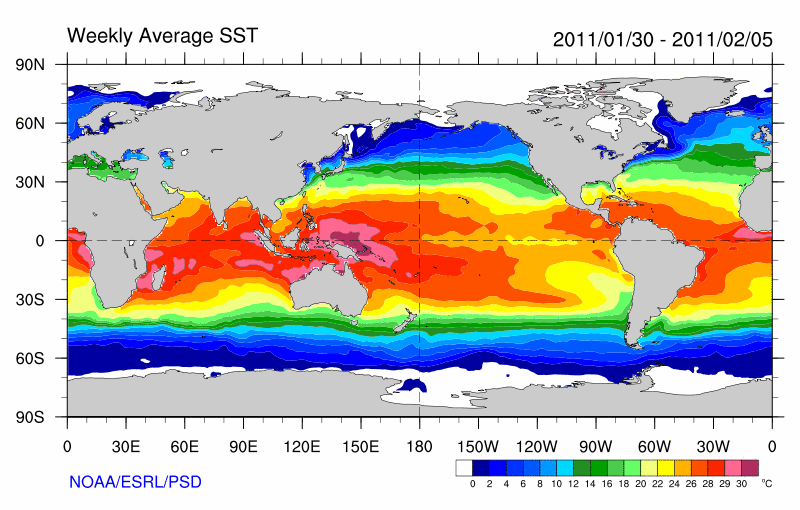
The solar radiation at different latitudes is different, and thus, the temperature is different. The global distribution pattern of sea temperature is progressive decrease from low latitude sea areas to high latitude sea areas.
As the amount of insolation decreases poleward, the temperature of surface water decreases from the equator towards the poles. The temperature of surface water between 40°N and 40°S is lower than air temperature but it becomes higher than air temperature between 40th latitude and the poles in both the hemispheres.
2.Unequal distribution of land and water
In the northern hemisphere, the oceans there receive more heat due to their contact with a larger extent of land whereas the ocean in the southern hemisphere receives less heat because of comparatively less contact with land than the northern hemisphere.
The isotherms are not regular and do not follow latitudes in the northern hemisphere becauses of the existence of both warm and cold landmassess whereas isotherms are regular and follow latitudes in the southern hemisphere becuase of the dominance of water.
The temperature in the enclosed seas in low latitudes becomes higher because of the influence of surrounding land areas than the open seas e.g., the average annual temperature of surface water at the equator is 26.7°C whereas it is 37.8° in the Red Sea and 34.4°C in the Persian Gulf.
3.Prevailing wind
Wind direction largely affects the distribution of temperature of ocean water.
The winds blowing from the land, flow towards the oceans or sea (e.g., offshore winds) driving the warm surface water away from the coast and resulting in the upwelling of cold water from below due to this, it results in longitudinal variation in the temperature.
On the other hand, the onshore winds that are winds blowing the oceans, pile up warm water near the coast and this raises the temperature.
For example, trade winds cause low temperature (in the tropics along the eastern margins of the oceans or the western coastal regions of the continents) because they blow from the land towards the oceans whereas these trade winds raise the temperature in the western margins of the oceans or the eastern coastal areas of the continents because of their onshore position.
Similarly, the eastern margins of the oceans in the middle latitudes (Western coasts of Europe and North America) have relatively higher temperature than the western margins of the oceans because of the onshore position of the westerlies.
4.Ocean Currents
In sea areas at the same latitude, the temperature of sea water where warm current flow is higher and the temperature of sea water where cold currents flow lower.
That is ocean plays an important role as the warm ocean currents raise the temperature in a colder area and the cold currents decrease the temperature in warm ocean areas.
Example
1.The Gulfstream which is a warm current raises the temperature near the eastern coast of North America and the West Coast of Europe.
2.The Labrador Current which is a cold current decrease the temperature close to the northeast coast of North America.
3.Kuro Shivo drives warm water away from the eastern coast of Asia and raises the temperature near Alaska.
Similarly, the temperature of the eastern coast of Siberia becomes low due to Kurile cool current. It may be mentioned that warm currents raise the temperature more in the northern hemisphere than in the southern hemisphere which is apparent from the face that the 5°C isotherm reaches 70° latitude in the northern Atlantic Ocean whereas it is extended upto only 50° latitude in the southern Atlantic ocean.
This is because of more dominant effects of the warm Brazil current in the southern Atlantic ocean.
Temperature of ocean water
5.Season
Sea temperature is high in the summer and low in the winter.
6.Depth
The progressive decrease in temperature is significant as the depth of the surface sea water increases, with variations being more obvious within 1000m. There is less variation from 1000 meters to 2000 meters, and low temperature is maintained all year at depths below 2000m.
The above factor highly influences the temperature of ocean currents locally.
7.Minor Factors
Minor factors include
1. Submarine ridges
2. Local weather conditions like storms, cyclones, hurrincanes, fog, clodiness, evaporation and condensation.
3.location and shape of the sea.
Longitudinally more extensive seas in the low latitudes have higher temperature than the latitudinally more extensive seas as the Mediterranean. Sea records higher temperature than the Gulf of California.
The enclosed seas in the low latitudes record relatively higher temperature than the open seas Example Mediterranean Sea, Red Sea, etc. whereas the enclosed seas have lower temperature that the open seas in the high latitudes. Example: North Sea, Baltic Sea 0°C and open seas have 4.4°C.
Horizontal and Vertical Distribution of Temperature
The temperature decrease as the depth increases can be seen by the temperature-depth profile of the Ocean Water and this profile shows the boundary region between the deep layers of ocean water and the surface waters.
This boundary starts around 100-400 m below the sea surface and extends up to several meters deep this boundary from where there is a rapid decrease of temperature is called the Thermocline and about 90% of the total volume of water is found below the Thermocline and also in this region, the temperature approaches 0° C (Approx).
The temperature structure of the oceans over the middle and low latitudes can be explained by a three-layer system from the surface to the bottom
Three-layer systems from the surface to bottom are:
First Layer
The first layer is the top layer which has Warm Oceanic Water and its thickness is about 500m with temperature that ranges from 20° and 25° C (Approx). The first layer is present within the tropical region and is present throughout the year in midlatitudes and it develops only during the Summer Season.
Second Layer
The Thermocline which is the Second layer lies below the first layer or top layer which has warm oceanic water. The Thermocline layer or second layer is characterized by a rapid decrease in temperature as the depth increases and the thickness of this layer is 500 – 1000m.
Third or Last Layer
The last layer is very cold and it is the third layer. It extends up to the deep ocean floor. In the Arctic and Antarctic circles, the oceanic water’s surface temperature is close to 0° C (Approx) and the temperature variation with the depth is very low. This is because here there is only one layer of cold water that extends from the surface to the ocean floor at the deep.
The average temperature of the surface oceanic water is around 27°C (Approx) and it gradually decreases from the equator towards the poles.
The rate of decrease of temperature with increase in latitude is commonly 0.5°C (Approx) per latitude and the average temperature of oceanic water is around 22°C (Approx) at 20° latitudes, 14 °C (Approx) at 40° latitudes and 0° C (Approx) near poles.
In comparison, the temperature of the ocean water in the Northern Hemisphere is higher than in the Southern Hemisphere. Also, the Highest temperature of the ocean water is recorded in the North of the equator, not at the equator. The average annual temperatures of the Northern Hemisphere are 19° C (Approx) and the Southern Hemisphere 16° C (Approx) respectively.
This difference in temperature is due to the unequal distribution of land and water in the North and South hemispheres. As already said, the maximum temperature of ocean water is at the surface, the top layer because it is exposed to direct sunlight and the lower layers get the heat by the process of convection and this is the reason for the decrease in temperature with depth.
But this decrease in temperature is uniform, and it decreases rapidly up to the depth of 200m and then, the rate of decrease in temperature is slow.
FAQ
What is the temperature of deep ocean water?
There is great change at greater depths, there is a temperature that ranges from around 30 °C(Approx) at the sea surface to −1 °C(Approx) at the seabed (bottom of the sea). The deep ocean for example below 200 meters is cold and its average temperature is only 4°C(Approx). Also, cold water is more dense than warm water.
How does water temperature change with depth?
Ocean water gets colder with depth, as only the top layer of water gets heat by sunlight and the layer below it gets heat by convection also the heat generated per square meter of Earth is very small to make ocean water warm. Also, the salty water stays at the bottom, which gets colder than less salty water which stays on the top layer.
How cold is the water at the bottom of the ocean?
The average temperature at the bottom is −1°C to 4°C (Approx).
Why is seawater warmer at night?
The heat absorbed by the top layer of water is mixed with the lower layer of water and as the top layer loses its temperature during the night it gets warm from the underneath layer and also lands gets cool faster than the water.
Does salinity increase with depth?
Yes, the salinity increases with depth because salty water is dense and heavier which stays low and the less salty water is less dense and stays on top. The halocline is the layer, where the salinity changes rapidly with depth.
Can oceans freeze?
Ocean water freezes at -2°C because of salt in it, as the normal water freezers at 0°C.
What part of the sea is the coldest?
The bottom of the Antarctic Ocean is the coldest of all and also it greatly influences the movements of water in other oceans.
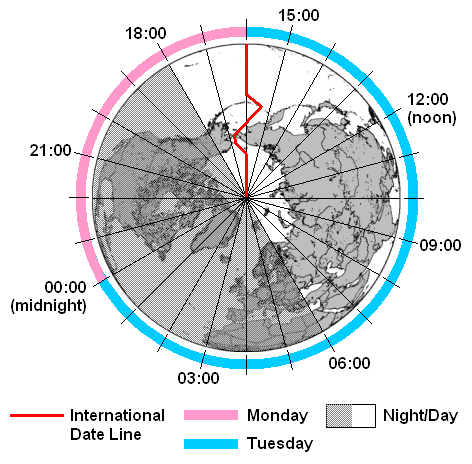
It is an imaginary line dividing the surface of the earth, which runs from the North Pole to the South Pole and demarcates the border between one calendar day and the next.
It serves as the “line of demarcation” between the two calendar days.
International date line By http://liftoff.msfc.nasa.gov – http://liftoff.msfc.nasa.gov/Academy/Rocket_Sci/clocks/time-gmt.html, Public Domain, https://commons.wikimedia.org/w/index.php?curid=2044080
Prime meridian
Is the Prime Meridian and the International Date Line the same thing?
The Prime Meridian separates the eastern Hemisphere from the Western Hemisphere. International Date Line is Halfway around the world, at 180-degree Longitude.
The prime meridian is present at 0 degrees Longitude.
What is the time difference between IDL and prime meridian?
The time difference between International Date Line and Prime Meridian is 12 Hours.
IDL Latitude and longitude
It passes through the Mid-Pacific Ocean and follows a 180-degree longitude North-South Line.
Location
It is located halfway around the world from the Prime meridian. The Zero degrees longitude is present or established in Greenwich England in 1852.
International date line passes through
International date line passes through which countries?
It passes through Samoa, Tokelau, Wallis and Futuna, Fiji, Tonga, Tuvalu, and New Zealand the Kermadec Islands and the Chatham Islands are all west of IDL and have the same date.
American Samoa, Cook Islands, Niue, and French Polynesia are located east of IDL and one day behind.
International date line passes through which strait?
It passes most of its to 180 degrees of longitude, but it bends eastward through the Bering Strait. It does so to avoid dividing Siberia and then bends westwards to include the Aleutian Island with Alaska.
International date line on map By Another Matt (talk) – I (Another Matt (talk)) created this work entirely by myself, incorporating a map from http://commons.wikimedia.org/wiki/File:Blankmap-ao-090N-north_pole.png , which is stated to be public domain, CC0, https://en.wikipedia.org/w/index.php?curid=34272122
International date line time zone
UTC−12:00 is an identifier for a time offset from UTC of −12:00. It is the last to enter a new year and is sometimes referred to as the International Date Line West time zone (IDLW).
International date line and arctic circle
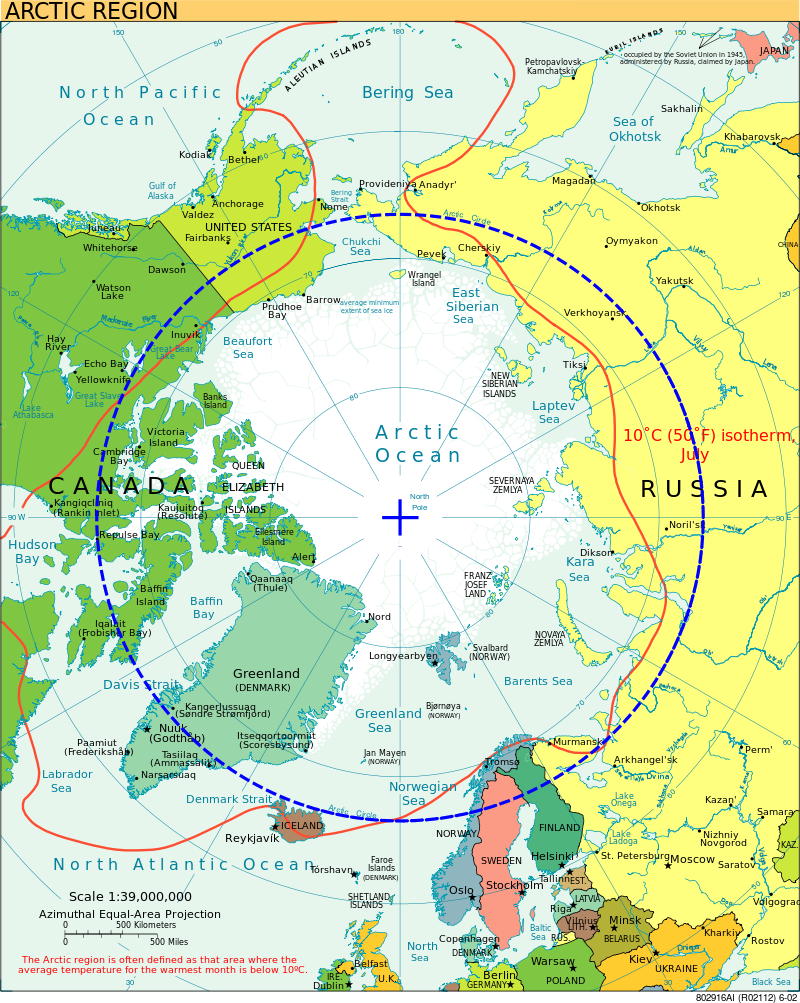
The Arctic circle is close to 16,000 km and the area north of the Circle is roughly 20,000,000 km2 which covers almost 4% of Earth’s Surface.
The Arctic is derived from the word “arktikos”, which means bear in the Greek language. The “Ursa Major” Constellation is viewed in the Northern sky. The arctic circle region, where at least 1 day a year will receive sunshine all day during summer and the full one day or 24 will not receive any light and will be dark throughout the day.
The arctic circle passes through the Arctic Ocean, the Scandinavian Peninsula, North Asia, Northern America, and Greenland.
The countries in the Arctic circle are eight, they are Norway, Sweden, Finland, Russia, the United States, Canada, Denmark, and Iceland.
IDL also separates Russia and the US off Alaska’s West Coast.
The Big Diomede Islands in Russia and Little Diomede in the USA are apart by 3.8 Km of the sea and IDL runs midway between them.
The Arctic and Antarctic Circles are the parallels of latitude that are roughly 66.5 degrees (66° 33′ 44″ (or 66.5622°).
Arctic circle latitude
Arctic Circle, parallel, or line of latitude around the Earth, at approximately 66°30′ N. This is due to the Earth’s inclination of about 23 1/2° to the vertical. This marks the southern limit of the area within which, for one day or more each year.
As a result, Sun does not set (about June 21) or rise (about December 21).
FAQ
a. Where is the dateline located?
The dateline is located, at a 0-degree longitude line in Greenwich, England. It was established in 1884 and passed through the mid-pacific ocean.
b.What is the longitude of the international date line?
It is 0-degree Longitude. It is the starting point.
c. Antarctic circle passes through which countries?
The country that passes through the Antarctic circle, is Antarctica only. But Antarctica is not a country, it is the southernmost continent.
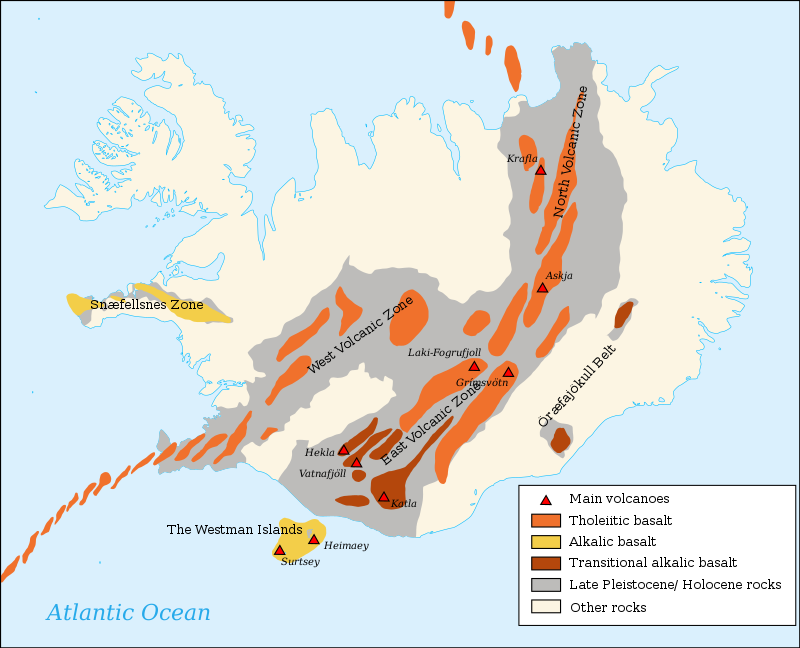
Most famous volcanoes in Iceland is Eyjafjallajokull because of its eruption in 2010. Other famous volcanoes are Katla, Öræfajökull, Bárðarbunga etc.
Mount Hekla has erupted 18 times, the last time it erupted was in 2000.
Iceland volcanoes names
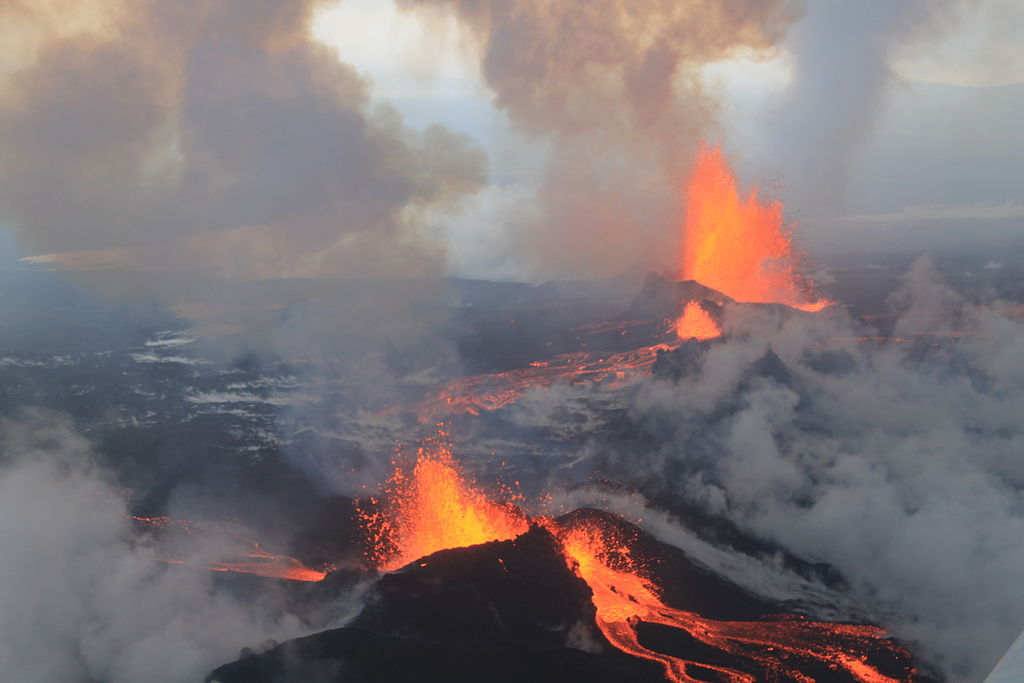
Iceland has a large concentration of active volcanoes, as it is located on the Mid-Atlantic Ridge, a divergent tectonic plate boundary.
It has over 30 active volcanic systems and each volcano’s tectonic fissure systems and most of them also stratovolcano, shield volcanoes. The most active volcano in this region is Grímsvötn.
Below is the list of the most famous volcanoes in Iceland.
Volcanoes in Iceland facts
There are around 130 volcanoes in Iceland. The reason behind such a high number of volcanoes is its location. As this Iceland nation lies where two tectonic plates meet.
As the two tectonic plates are not fused, an extremely hot substance known as lava rises from inside.
Fagradalsfjall
Fagradalsfjall volcano is part of the Krýsuvík-Trölladyngja volcanic system on the Reykjanes Peninsula in southwest Iceland.
Katla volcano
It is one of the largest volcanoes in Iceland. It is situated to the north of Vík í Mýrdal and to the east of the smaller glacier Eyjafjallajökull.
Grímsvötn
It is located in Vatnajökull National Park, Iceland. Grímsvötn, a subglacial volcano, is located 140 km NE of Eyjafjallajökull volcano within the western region of the Vatnajökull glacier. It is a type of Caldera.
Hekla
Hecla, is a stratovolcano in the south of Iceland with a height of 1,491 m (4,892 ft). Hekla is one of Iceland’s most active volcanoes. It is the most famous and active volcano in the country.
Askja
It is an active volcano, situated in the remote part of the central highlands. The most recent eruption was in 1961. It is a type of basaltic.
Snæfellsjökull
Snæfellsjökull is a 700,000-year-old glacier-capped stratovolcano in western Iceland. It is situated in the most western part of the Snæfellsnes peninsula. It is present in the West Iceland glaciers.
Volcanic Areas in Iceland – By Volcanic_system_of_Iceland-Map-fr.svg: Pinpinderivative work: Chris.urs-o (talk) – Volcanic_system_of_Iceland-Map-fr.svg, CC BY-SA 3.0, https://commons.wikimedia.org/w/index.php?curid=9877884
Eldfell
Eldfell is a volcanic cone just over 200 metres (660 ft) high on the Icelandic island of Heimaey. Eldfell is a volcano in the Westman Islands, off the South Coast of Iceland, which famously erupted in the middle of the town of Heimaey in 1973.
Öræfajökull
It is an ice-covered volcano in southeast Iceland. Its type is Stratovolcano. It is shaped like a cone, with a large ice-filled caldera, and is 600-700 m deep. It has erupted twice once in 1362 and the other in 1728.
Eldgjá
It is situated in Landmannalaugar and Kirkjubæjarklaustur. Eldgjá is the largest volcanic canyon in the world, approx. It is an example of a shield volcano.
Hengill
It is situated in the southwest of Iceland, which is south of Þingvellir. It is a mountain that covers an area of 100 square kilometres. Geothermal energy is produced, which is a vital source of energy for south Iceland.
Torfajökull
It is a rhyolitic stratovolcano, caldera, and a complex sub-glacial which is located north of Mýrdalsjökull and south of Þórisvatn Lake. It last erupted in March 1477.
Vatnafjöll
Vatnafjöll is a 40 km (25 mi) long, 9 km (6 mi) wide basaltic fissure vent system that is located southeast of Hekla, Iceland. It last erupted 1200 years ago.
Esjufjöll
Esjufjöll is a small volcanic system and as such part of Iceland’s Oræfi Volcanic Belt. The subglacial Esjufjöll volcano located at the SE part of the Vatnajökull icecap, north of Öraefajökull, consists of the Snaehetta central volcano and a large caldera.
Ljósufjöll
Ljósufjöll is a fissure vent system and central volcano on the Snæfellsnes Peninsula in Iceland. The system has a length of about 90 km. It last erupted in 960 CE.
Prestahnúkur
The volcano Prestahnúkur is located in the west of the Highlands of Iceland to the west of Langjökull glacier.
Grímsnes
Grímsnes is a fissure or crater row volcanic system located in South Iceland, a relatively small volcanic system located SE of Thingvallavatn lake east of an en-echelon group of volcanic sites extending across the Reykjanes Peninsula.
It last erupted in May 2011.
Herðubreið
Herðubreið is a tuya in the northern part of Vatnajökull National Park, Iceland. It is situated in the Highlands of Iceland on the east side of the Ódáðahraun desert and close to Askja Volcano.
Kerlingarfjöll
It is part of a tuya volcano system of 100 sq. km. It has numerous hot springs. It is glacially dissected.
Hverfjall
Hverfjall also known as Hverfell is a tephra cone or tuff ring volcano in northern Iceland. Last erupted in 2500 BP.
Theistareykjarbunga
Theistareykjarbunga is a shield volcano in northeastern Iceland with two fissure vents called Theistareykjahraun and Borgahraun. It last erupted in 900 BC.
Kollóttadyngja
Kollóttadyngja is a shield volcano in the Ódáðahraun lava field in Iceland. Its height is 1,177 metres, and it has a diameter of 6–7 km.
Bláhnjúkur
Bláhnjúkur is a volcano in the south of Iceland. Its height is 940 m.
Trölladyngja
Trölladyngja is the biggest of the Icelandic shield volcanoes, reaching a height of 1,468 metres (4,816 ft) above sea level.
Helgafell
Helgafell is an inactive 227-meter-high volcanic cone located on the island of Heimaey in the Vestmannaeyjar archipelago in Iceland.
Búrfell
Búrfell is a 480 m (1,570 ft) basalt tuya located in Iceland.
Brennisteinsalda
The Brennisteinsalda is a volcano in the south of Iceland. Its height is about 855 m. It is situated near Landmannalaugar and not far from Hekla.
Conclusion
Iceland has around 130 volcanoes, and mostly it has stratovolcanos, which is a cone-shaped peaks. Also, there are shield volcanoes.
The ocean has great depression features. The oceans are similar to continents that merge into one another and it is difficult to demarcate them. The oceans are divided by Geographers as Pacific, Atlantic, Indian, Southern Ocean, and the Arctic. These oceans consist of various seas, bays, gulfs, and other inlets.
A major part of the ocean floor is found between 3-6 km below sea level. The land under the ocean is the ocean floor which shows complex and different characteristics similar to those variants on the land. The Bottom relief features of the Ocean Floor consist of rugged mountain chains, ranges, deepest trenches, and large plains.
These relief features are formed similar to continents by tectonic, volcanic, and deposition processes.
Relief of the ocean floor
Division of Bottom relief features of Ocean
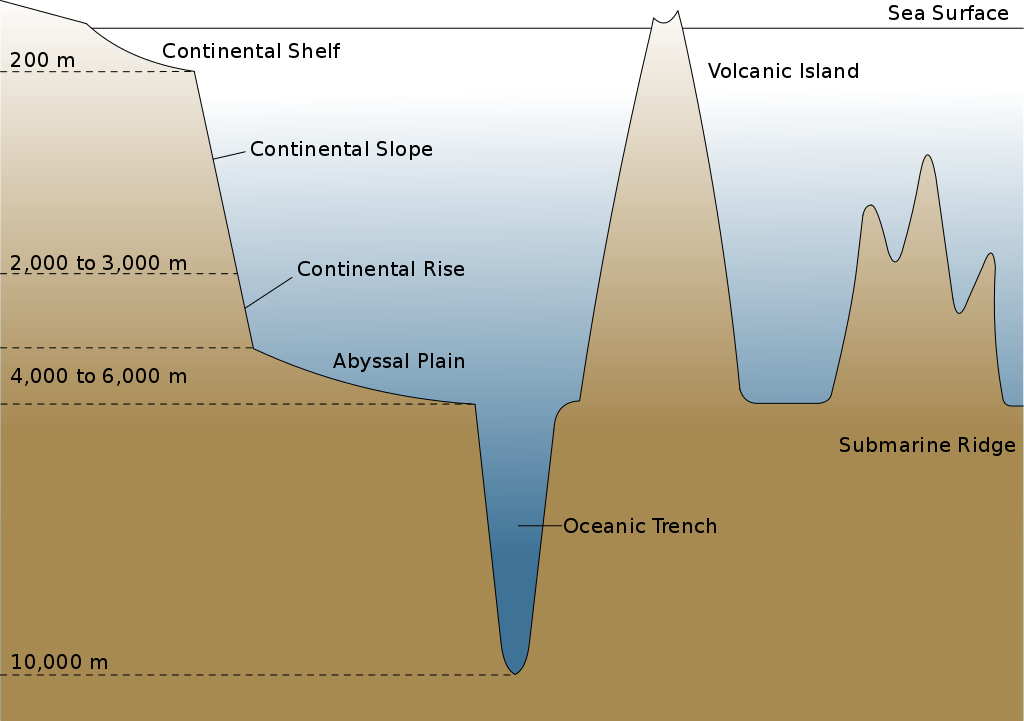
The ocean floor is divided into:
Continental Shelf
Continental Slope
Deep Sea Plain
Oceanic Deeps
Apart from the above four major divisions, there are also minor divisions such as Ridges, hills, sea, mounts, guyots, trenches, canyons, etc.
Continental Shelf
It is the extended margin of every continent that is occupied mostly by shallow seas and gulfs. The continental shelf is the shallowest part of the ocean and shows an average gradient of 1° or even less. The continental shelf mostly ends at a very steep slope called the shelf break. The width of the continental slope differs from one ocean to another and its average width is around 80 km.
The continental shelves are mostly absent or very narrow along the coasts of Chile, the west coast of Sumatra, etc. On the other hand, the Siberian shelf in the Arctic Ocean is the largest in the world and stretches about 1500 km in width.
The depth of the continental shelf also differs, it might be as shallow as 30m or as deep as 600m. These shelves are covered with different thicknesses of sediments which are carried down by wind, rivers, glaciers, etc and distributed by waves and currents.
These massive deposits on shelves over a long period of time have become the source of fossil fuels.
Continental Slope
It connects the continental shelf and the ocean basins. The continental slope starts where the bottom of the continental shelf sharply drops into a steep slope.
The gradient of the slope region varies between 2-5°. The depth of the continental slope is between 200 to 3000 metre. The boundary of the slope indicates the end of the continents and also Canyons and trenches are found in these regions.
Deep-Sea Plain
These plains are gently sloping areas of the ocean basins and these are the flattest and smoothest regions of the world. Its depth varies from 3000 to 6000 m. The deep-sea plains are covered with fine-grained sediments such as clay and silt.
Oceanic Deeps or Trenches
Trenches are the deepest parts of the oceans. It is relatively steep-sided and has narrow basins. It is also 3-5 km deeper than the surrounding ocean floor. The trenches are found at the base of continental slopes, near island areas, and are related to active volcanoes and earthquakes.
As of now, 57 trenches have been found and out of them, 32 are found in the Pacific, 19 found in the Atlantic, and 6 in the Indian Ocean.
Minor Bottom relief features of Ocean
Mid Oceanic Ridge
It is two chains of mountains that are separated by a huge depression. These mountain ranges can be as high as 2500 m and some stay at ocean level. Iceland is part of the mid-Atlantic Ridge.
Seamount
Seamount is a mountain with pointed summits that rises from the seafloor and does not reach the surface of the ocean. These are of volcanic origin, their height is around 300-4500 m.
Example: the Hawaiian Islands in the Pacific Ocean
Submarine Canyons
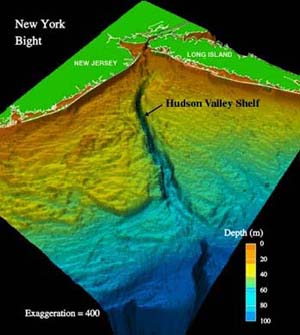
Submarine Canyons are deep valleys similar to the Grand Canyon. These are commonly found across the continental slopes and shelves.
Hudson Canyon, Public domain, via Wikimedia Commons
Example: Hudson Canyon
Guyots
Guyots are flat-topped seamounts. This shows pieces of evidence of gradual subsidence through stages to become a flat-topped submerged mountain.
It is estimated that there are 10,000 Guyots in the Pacific Ocean.
Atoll
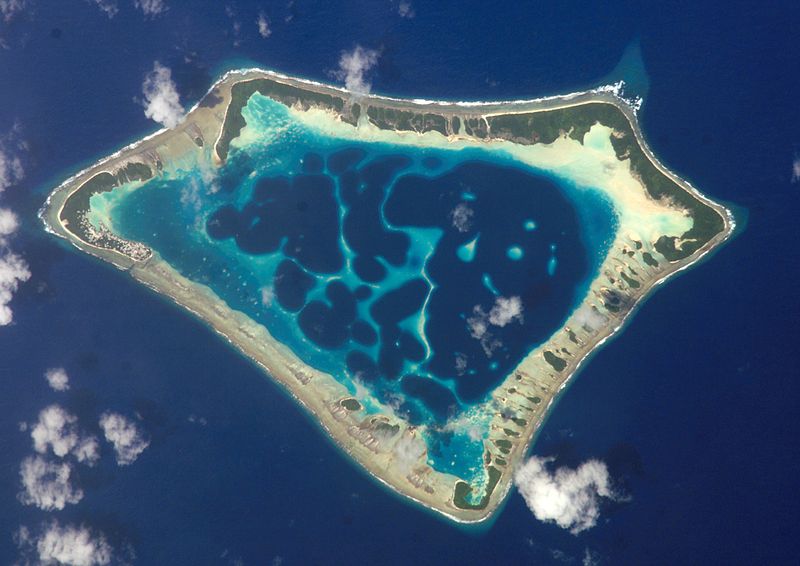
The atoll is a low island seen in the tropical ocean consisting of coral reefs surrounding a central depression.
Atoll – Source: Atafu.jpg: NASA Johnson Space Center
These might be part of the sea lagoon or forms enclosing a body of fresh, brackish, or saline water.
Conclusion
This article is written for the topic ‘Ocean bottom relief features’ for Upsc and state service exams. This article includes the Continental Shelf, Continental Slope, Deep Sea Plain, Oceanic Deeps, and other minor ocean reliefs.
Cyclone disaster management is most important, as cyclone affects coastal India maximum than any other. India has a coastline of about 7516 km and it is exposed to 10% of the world’s tropical cyclones.
In India, ten states are vulnerable to flood-prone. They are Gujarat, Maharashtra, Goa, Karnataka, Kerala, Tamil Nadu, Pondicherry, Andhra Pradesh, Orissa, and West Bengal. The islands of Andaman, Nicobar, and Lakshadweep are also prone to cyclones.
Flood Prone Districts in Tamil Nadu
Districts in Tamil Nadu which are frequently affected by cyclones: All the 13 coastal districts of Tamil Nadu are affected by cyclonic storms that occur during May- June and in the October-November months.
These Districts are Tiruvallur, Chennai, Kancheepuram, Villupuram, Cuddalore, Nagapattinam, Tiruvarur, Thanjavur, Pudukkottai, Ramanathapuram, Tuticorin, Tirunelveli, and Kanniyakumari.
On average, about five or six tropical cyclones form in the Bay of Bengal and the Arabian sea and hit the coast every year. Out of these, two or three are severe. When a cyclone approaches the coast, a risk of serious loss or damage occurs from severe winds, heavy rainfall, storm surges, and river floods.
The effect of a storm surge is most pronounced in wide and shallow bays exposed to cyclones such as in the northern part of the Bay of Bengal.
Most cyclones occur in the Bay of Bengal followed by those in the Arabian Sea and the ratio is approximately 4:1. During the cyclonic of cyclonic storms, wind speed is between 65 km/h and117 km/h.
Rules of action before a cyclone
Go to high-lying places from low-lying areas
Those residing in old buildings should temporarily relocate to safer buildings; Jewels and documents should be kept in safe custody.
Battery-operated radio, plastic torchlight, lamp, kerosene, match-box should be kept safely for future use.
Keep in ready all the first-aid kits and material available with you.
Keep in stock foodstuffs, material, fuel, drinking water, and life-saving drugs needed for the next week.
It is also important to take cattle and other pets to safer places and also it is important to know that if we see quickly approaching storm clouds it is possible to predict strong winds several minutes in advance.
Population pyramids are graphical representations of the age and sex of a population. Due to this reason, it is also referred to as age-sex pyramids.
These graphs are usually shaped like triangles and population pyramids also take other shapes.
Population pyramids usually have males on the left side and females on the right side. There is also a vertical line in the middle of the graph that separates the males from the females.
Literacy Rate
The total number of literate persons in a given age group is expressed as a percentage of the total population in that age group. Literacy rates continue to rise from one generation to the next.
Yet according to new data from the UNESCO Institute for Statistics, there are still 750 million illiterate adults, two-thirds of whom are women.
These numbers are a stark reminder of the work ahead to meet Sustainable Development Goals (SDGs) 4 and 5 and the Education 2030 targets.
Age – Sex pyramids
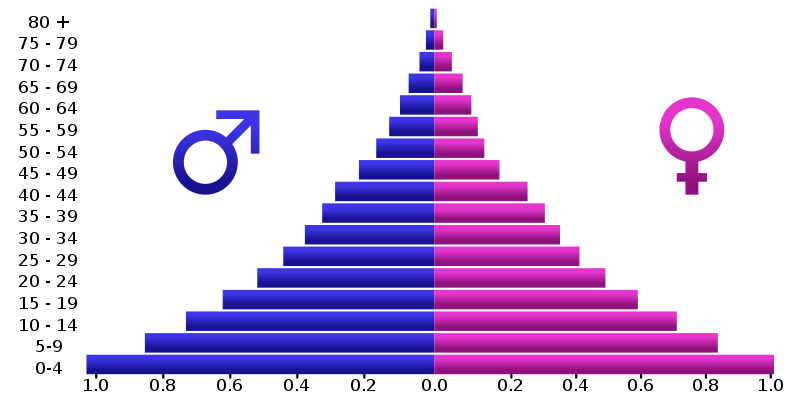
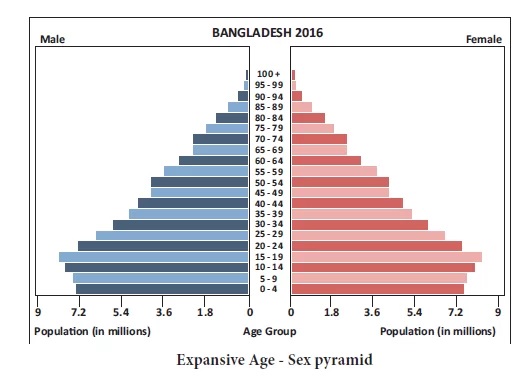
There are three types of Age – Sex pyramids: expansive, constrictive, and stationary. Expansive Age – Sex pyramids depict populations that have a larger percentage of people in younger age groups.
Populations with this shape usually have high fertility rates with lower life expectancies. Many third-world countries have expansive age-sex pyramids.
Such a population pyramid is a characteristic of newly developing countries such as Afghanistan, Bangladesh, Kenya, and some countries of Latin America.
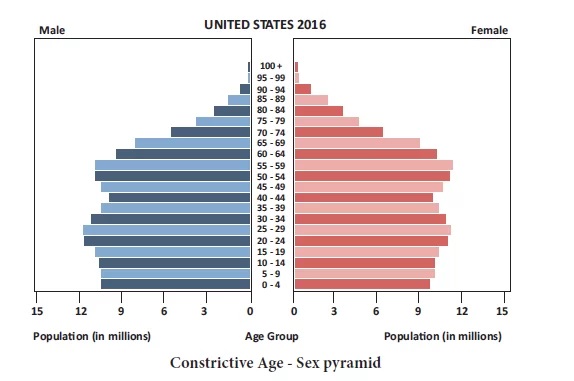
Constrictive Age – Sex pyramids are named so because they are constricted at the bottom. There is a lower percentage of younger people.
Constrictive Age – Sex pyramids show declining birth rates since each succeeding age group is getting smaller and smaller. The
The United States has a constrictive Age – Sex pyramid.
Stationary population pyramid
Stationary population pyramids are used to describe the population that is not growing. This pyramid looks like a rectangular shape, as it shows equal percentages across ages.
The stationary oldest-old population is shaped by a constant number of persons annually reaching age 80 and then being subject to constant mortality.
Austria has a stationary population pyramid.
Sex Pyramids
Sex pyramids are those that show a somewhat equal proportion of the population in each age group. There is not a decrease or increase in population; it is stable.
Austria has a stationary Age – Sex pyramid.
The Purpose of the Age – Sex Pyramid The purpose of making this Age – Sex pyramid is to find out the comparison between the number of men and women, the number of workers, and the structure of the population in a country quickly.
In addition, the creation of the Age – Sex Pyramid also has a purpose to assist the government in taking development policies.
Country the loses most Population
Syria’s population is on a decline rate that is far ahead of all other nations.
The total number of literate people in a given age group is expressed as a percentage of the total population in that age group.
Literacy rates continue to rise from one generation to the next. According to new data from the UNESCO Institute for Statistics, there are still 750 million illiterate adults, and two-thirds of them are women.
These numbers are a stark reminder of the work ahead to meet Sustainable Development Goals (SDGs) 4 and 5 and the Education 2030 targets.
Literacy rate variations between States in India
India’s India’s literacy rate is 74.04%
Kerala achieved a literacy rate of 93.91%
The lowest is in Bihar, with a literacy rate of 63.82%.
Several other social indicators of the two states are correlated with these rates, such as:
Life expectancy at birth (71.61 for males and 75 for females in Kerala, 65.66 for males and 64.79 for females in Bihar)
Infant mortality per 1,000 live births (10 in Kerala, 61 in Bihar), the birth rate per 1,000 people (16.9 in Kerala, 30.9 in Bihar) and death rate per 1,000 people (6.4 in Kerala, 7.9 in Bihar).
Six Indian states account for about70% of all illiterates in India: Uttar Pradesh, Bihar, Madhya Pradesh, Rajasthan, Andhra Pradesh, and West Bengal.
Slightly less than half of all Indian illiterates (48.12%) are in the six Hindi-speaking states of Uttar Pradesh, Bihar, Rajasthan, Madhya Pradesh, Jharkhand, and Chhattisgarh.
Tripura literacy success
Presently Tripura has the highest literacy rate in India, 94.65 per cent. According to the 2011 census, the literacy level was 93.91 per cent in Kerala and 91.58 per cent in Mizoram, among the most literate states in the country.
The national literacy rate, according to the 2011 census, was 74.04 per cent. The Tripura success story is attributed to the involvement of local government bodies, including gram panchayats, NGOs, and local clubs under the close supervision of the State Literacy Mission Authority (SLMA) headed by the chief minister.
Tripura attained 87.75 per cent literacy in the 2011 census, from the 12th position in the 2001 census to the 4th position in the 2011 census. Among projects implemented by the state government to increase literacy in the state are 10,000 Anganwadi centres with 100 per cent enrolment.
The policy of no-fail till class VIII to prevent children from dropping out. Midday meals in all schools with an eclectic menu for all days of the week to attract more students.
No tuition fees in government colleges.
The holistic education system, implemented with equal interest in Agartala, remote areas, and the tribal autonomic areas, emphasises that people in Tripura do not just become literate but educated.
One pointer to the government’s interest in education is the near-total absence of child labour in Tripura.
We can divide factors causing migrations into two groups of factors as push and pull factors.
Push and Pull factors
Push and pull factors are those factors that either forcefully push people into migration or attract them. A push factor is forceful, and a factor that relates to the country from which a person migrates.
A pull factor is something concerning the country to which a person migrates. It is generally a benefit that attracts people to a certain place. Push and Pull factors are usually considered as north and south poles on a magnet.
Push Factors:
Not enough jobs, few opportunities, desertification, famine/drought, political fear/ persecution, poor medical care, loss of wealth, natural disasters, death threats, slavery, pollutions, poor housing, landlords, bullying, and poor chances of finding courtship
Pull Factors:
Job opportunities, better living conditions, political and or religious freedom, enjoyment, education, better medical care, security, family links, industry, better chances of finding courtship.
Overpopulation
Overpopulation is the state whereby the human population rises to an extent exceeding the carrying capacity of the ecological setting. In an overpopulated environment, the number of people might be more than the available essential materials for survival such as transport, water, shelter, food, or social amenities.
This regularly contributes to environmental deterioration, worsening in the quality of life, or even the disintegration of the population. Due to immigration, the decline in mortality rates, medical breakthroughs, and increased birth rates, populations will always increase and eventually gives rise to overpopulation.
Migration means the movement of people from one place to the other. It is an important control of population growth after fertility and mortality.
Migration of people into an area from outside is called immigration or in-migration while moving out of an area to other regions is called emigration or out-migration.
Immigration leads to an increased growth rate of population, emigration lowers the growth rate of population in the source region.
Mexico’s emigration problem is a unique one, with more than 98% of all Mexican migrants living in the U.S.A, the country with which
Mexico shares a border that runs 3110 km in length. The Mexican emigration rate increased substantially since the 1960s and, with more
than 11% of Mexicans living abroad, Mexico is the country with the largest number of emigrants in the world. According to estimates
from the UN 2015 report, in 2013, the United States, Germany and Russia had the largest number of immigrants of any country, while
Tuvalu and Tokelau had the lowest immigrant.
Types of migration
Net Migration
Net Migration is the difference between immigration (in-migration) and emigration (out-migration).
A positive value of net migration is that more people coming in and population growth, for example, 44% of North America and 88% of Europe. A negative value of migration is more people coming out and population decline.
International Migration
Emigration is an indicator of the economic and or social failures of society. It is a crossing of a national boundary. It is easier to control and monitor.
There are laws to control or inhibit these movements. Between 2 million and 3 million people emigrate each year.
Between 1965 and 2000, 175 million people have migrated: it accounts for 3% of the global population.
Internal Migration
It occurs within a country. It is the crossing of the population within domestic jurisdictional boundaries. It is the movement of people between states or provinces. There is little government control over internal migration.
Local Migration
Local migration is the migration of the people within a state or district. No state boundaries are crossed in the local migration. It happens for several reasons such as buying a new house in the same town or city, difficult to research since they are usually missed in census data. It is based on a change of income or lifestyle. Americans change residence every 5 to 7 years.
Voluntary migration
Voluntary migration is where the migrant makes the decision to move. Most migration is voluntary.
Involuntary migration
It is a forced migration in which the migrant has no role in the decision-making process. It includes mostly slavery. It is estimated that about 11 million African slaves were brought to the Americas between 1519 and 1867.
In 1860, there were close to 4 million slaves in the United States. People involved in involuntary migration are refugees due to military conscription, children of migrants, people in situations of divorce or separation.
Brain Drain
Brain drain is related to educationally specific selective migrations. Some countries are losing the most educated segment of their population. It can be both a benefit for the receiving country and a problem for the country of origin.
Receiving country
It is getting highly qualified labor which is contributing to the economy right away. It promotes economic growth in strategic sectors: science and technology.
It does not have to pay education and health costs, for example, 30% of Mexicans with a Ph.D. are in the US.
Country of origin
Education and health costs are not paid back to the country of origin. It is losing potential leaders and talent: Between 15 and 40% of a graduating class in Canada will move to the US.
It has a long-term impact on economic growth. It has the possibility of getting remittances. Many brain drain migrants have skills that they can’t use at home: The resources and technology may not be available there. The specific labor market is not big enough.
* * All the Notes in this blog, are referred from Tamil Nadu State Board Books and Samacheer Kalvi Books. Kindly check with the original Tamil Nadu state board books and Ncert Books.